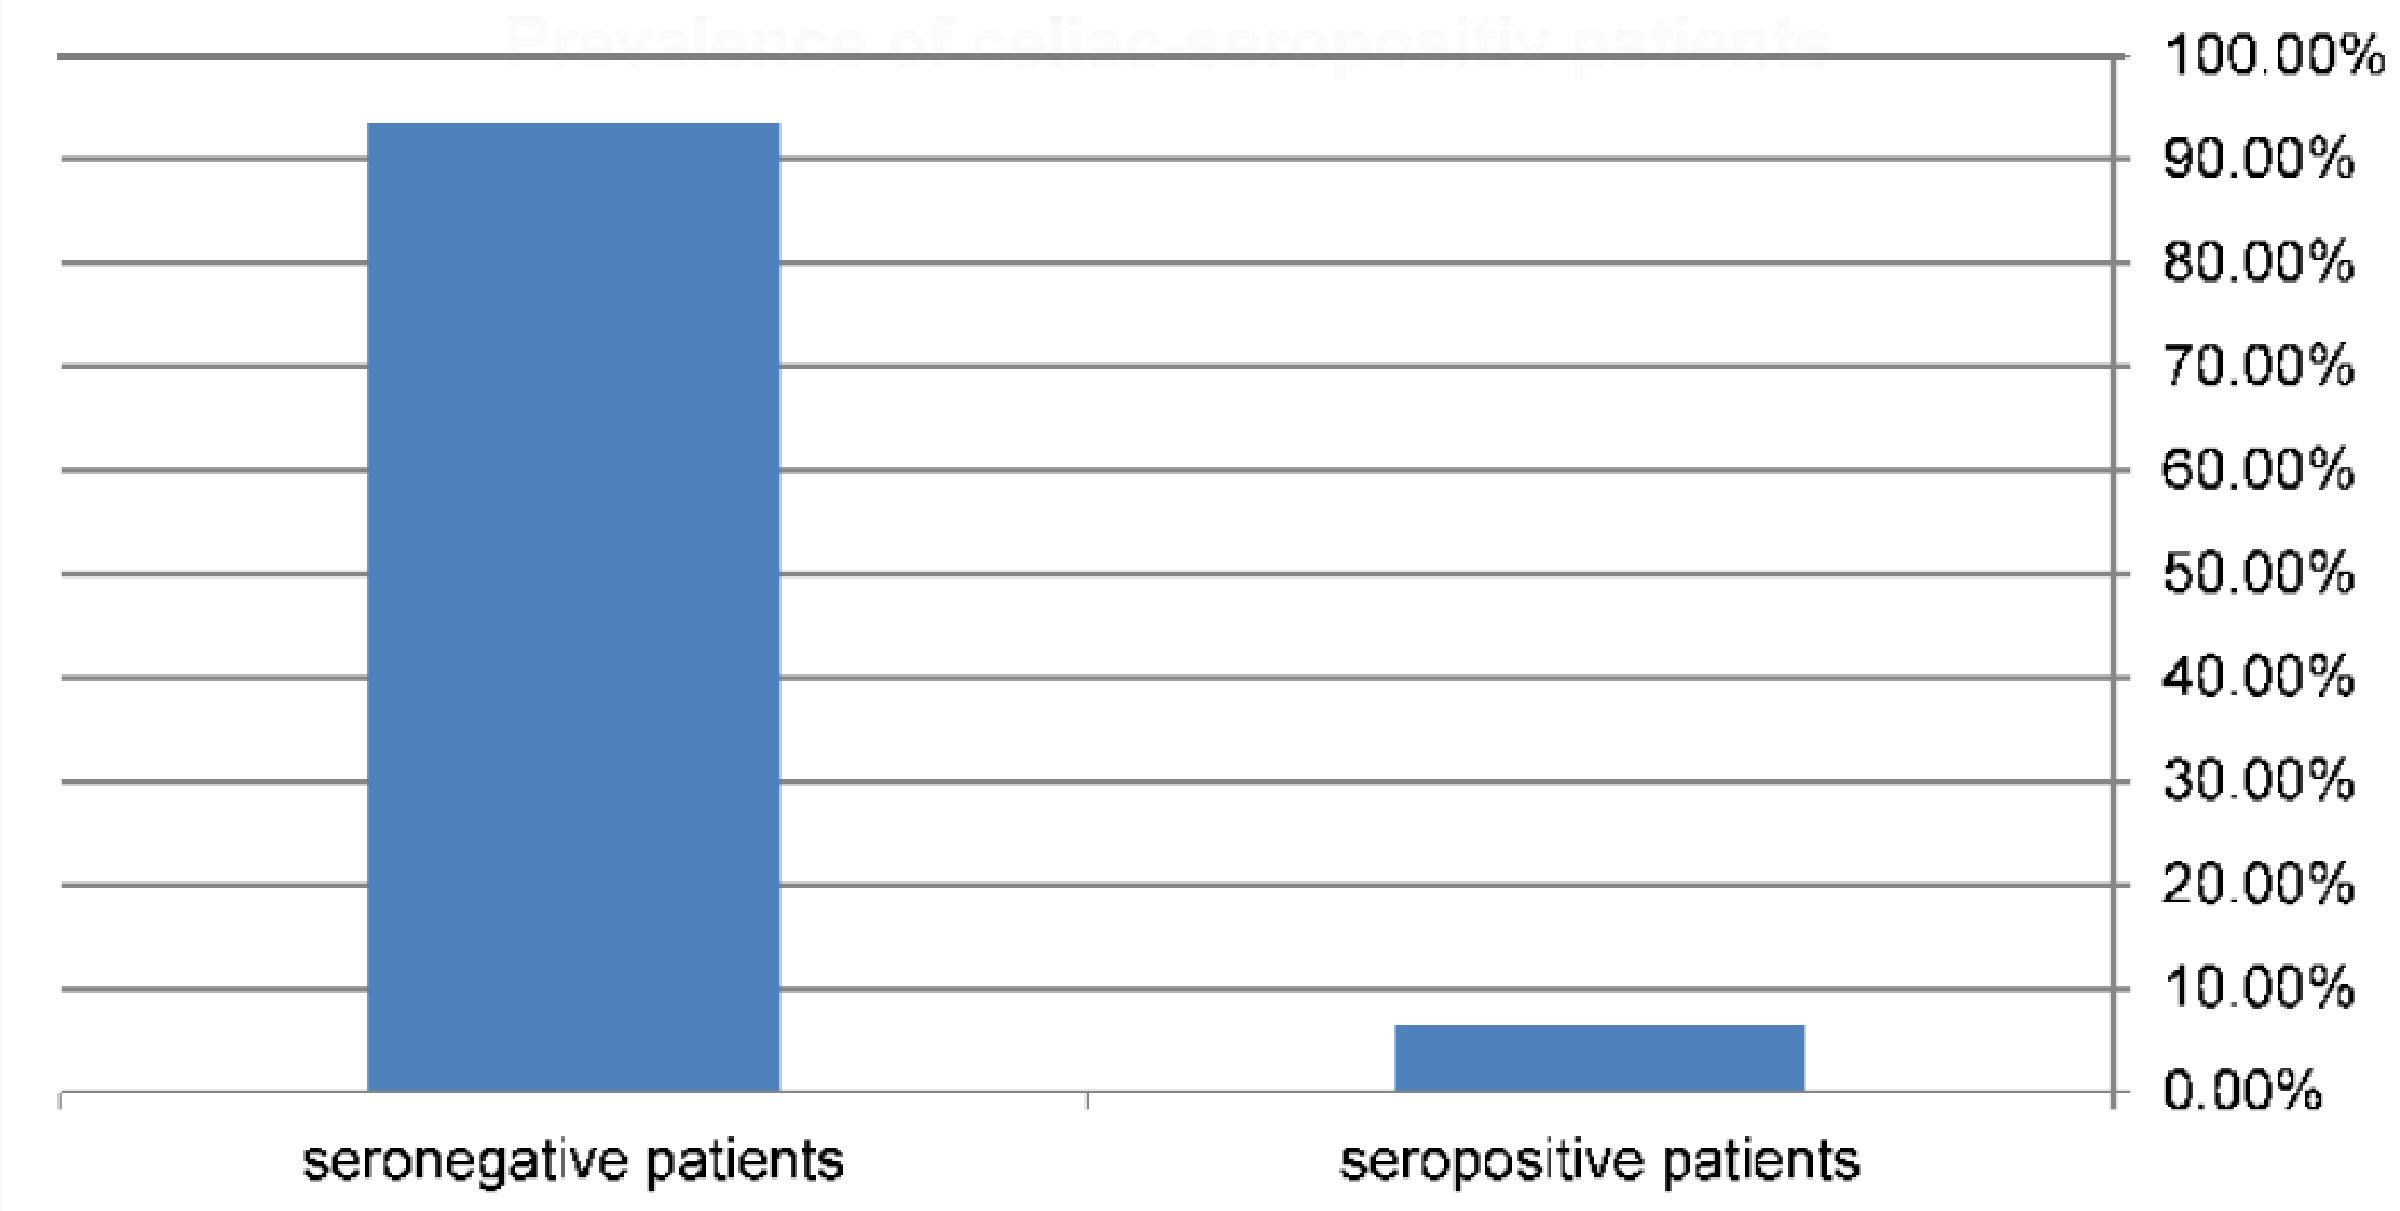
Figure 1. Prevalence of diabetic patients that have celiac seropositive results = 6.5% (9/138).
| Journal of Endocrinology and Metabolism, ISSN 1923-2861 print, 1923-287X online, Open Access |
| Article copyright, the authors; Journal compilation copyright, J Endocrinol Metab and Elmer Press Inc |
| Journal website http://www.jofem.org |
Original Article
Volume 8, Number 2-3, May 2018, pages 37-42
Serologic Screening of Celiac Disease in Patients With Type 1 Diabetes
Figures
Tables
| Variable | Minimum | Maximum | Mean | Standard deviation |
|---|---|---|---|---|
| Age (years) | 1.00 | 26.00 | 16.53 | 5.62 |
| Weight (kg) | 7.00 | 133.00 | 62.52 | 23.38 |
| Length (cm) | 75.00 | 186.00 | 1.57 | 20.30 |
| BMI | 7.77 | 48.29 | 24.48 | 7.05 |
| HbA1c value (%) | 6.40 | 12.80 | 8.67 | 1.56 |
| Triglycerides value (mg/dL) | 48 | 430.00 | 2.10 | 136.71 |
| Cholesterol value (mg/dL) | 68.00 | 400.00 | 2.15 | 88.17 |
| Fasting glucose value (mg/dL) | 51.00 | 450.00 | 1.20 | 52.33 |
| Hemoglobin level (Hb) | 7.67 | 17.00 | 12.14 | 1.68 |
| IgA-TGA | Mean | SD | P value | |
|---|---|---|---|---|
| Age (years) | No | 16.81 | 5.56 | 0.024 |
| Yes | 12.44 | 5.25 | ||
| Weight (kg) | No | 63.80 | 22.79 | 0.015 |
| Yes | 44.22 | 25.29 | ||
| HbA1c value (%) | No | 8.57 | 1.51 | 0.007 |
| Yes | 10.00 | 1.62 | ||
| Cholesterol value (mg/dL) | No | 208.43 | 87.03 | 0.001 |
| Yes | 308.89 | 36.56 | ||
| BMI | No | 24.84 | 7.014 | 0.022 |
| Yes | 19.30 | 5.56 |
| Variables | P value* |
|---|---|
| *Fisher exact P value. | |
| Patient complain of eczema | 0.025 |
| Patient diagnosed as eczema | 0.006 |
| Family history of celiac disease | 0.004 |
| Family history of DM 1 | 0.019 |
| Categorical variable | P-value | AOR* | 95% CI ( AOR) | |
|---|---|---|---|---|
| Lower | Upper | |||
| *Adjusted odd ratio. | ||||
| Patient’s diagnosis of eczema | 0.006 | 32.662 | 2.675 | 398.846 |
| Family history of T1DM | 0.041 | 5.794 | 1.072 | 31.328 |
| Variable | AOR* | 95% CI (AOR) | Chi-square | P value |
|---|---|---|---|---|
| *Adjusted odds ratios. | ||||
| HbA1c | 1.76 | 1.134 - 2.741 | 6.66 | 0.010 |
| Cholesterol | 1.018 | 1.006 - 1.031 | 12.78 | < 0.001 |