Figures
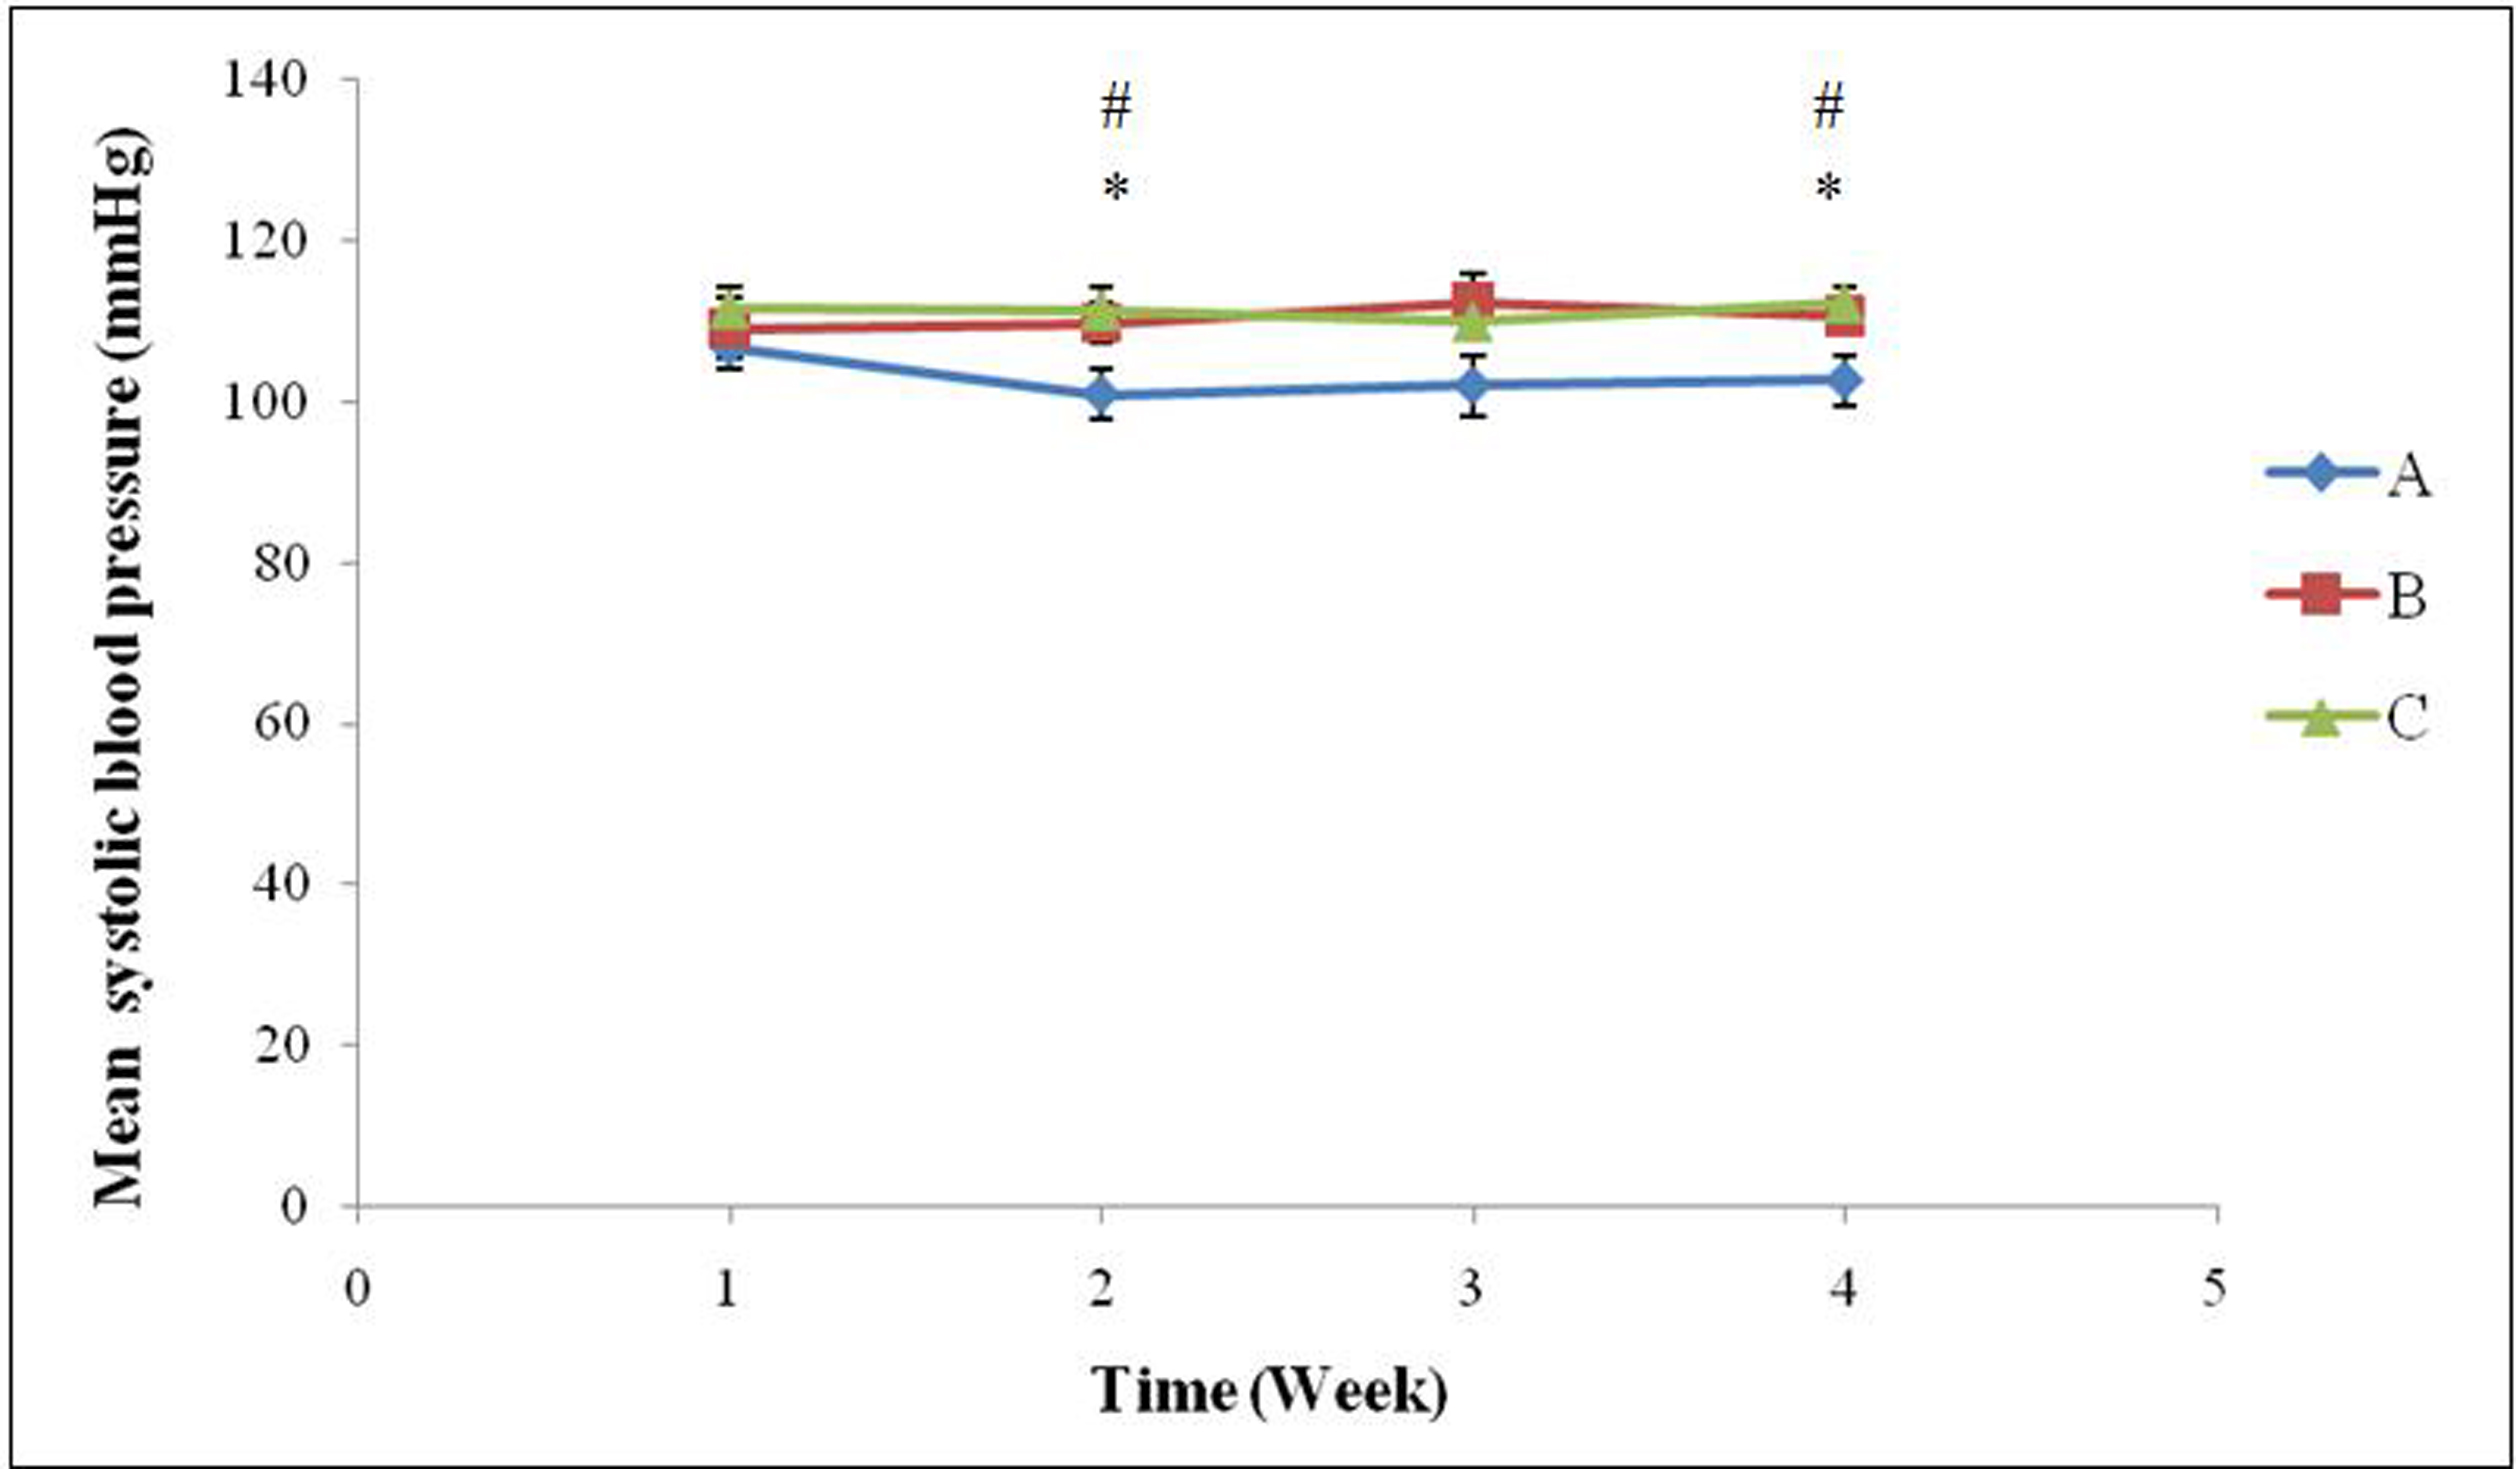
Figure 1. Mean systolic blood pressure (mmHg) in the three groups of rats over a 4-week treatment period (* indicates significant difference between Groups A and B (P < 0.05) and # indicates significant difference between Groups A and C (P < 0.05). Group A, Normal Diet; Group B, High-sucrose diet; Group C, High-sucrose diet + GA.
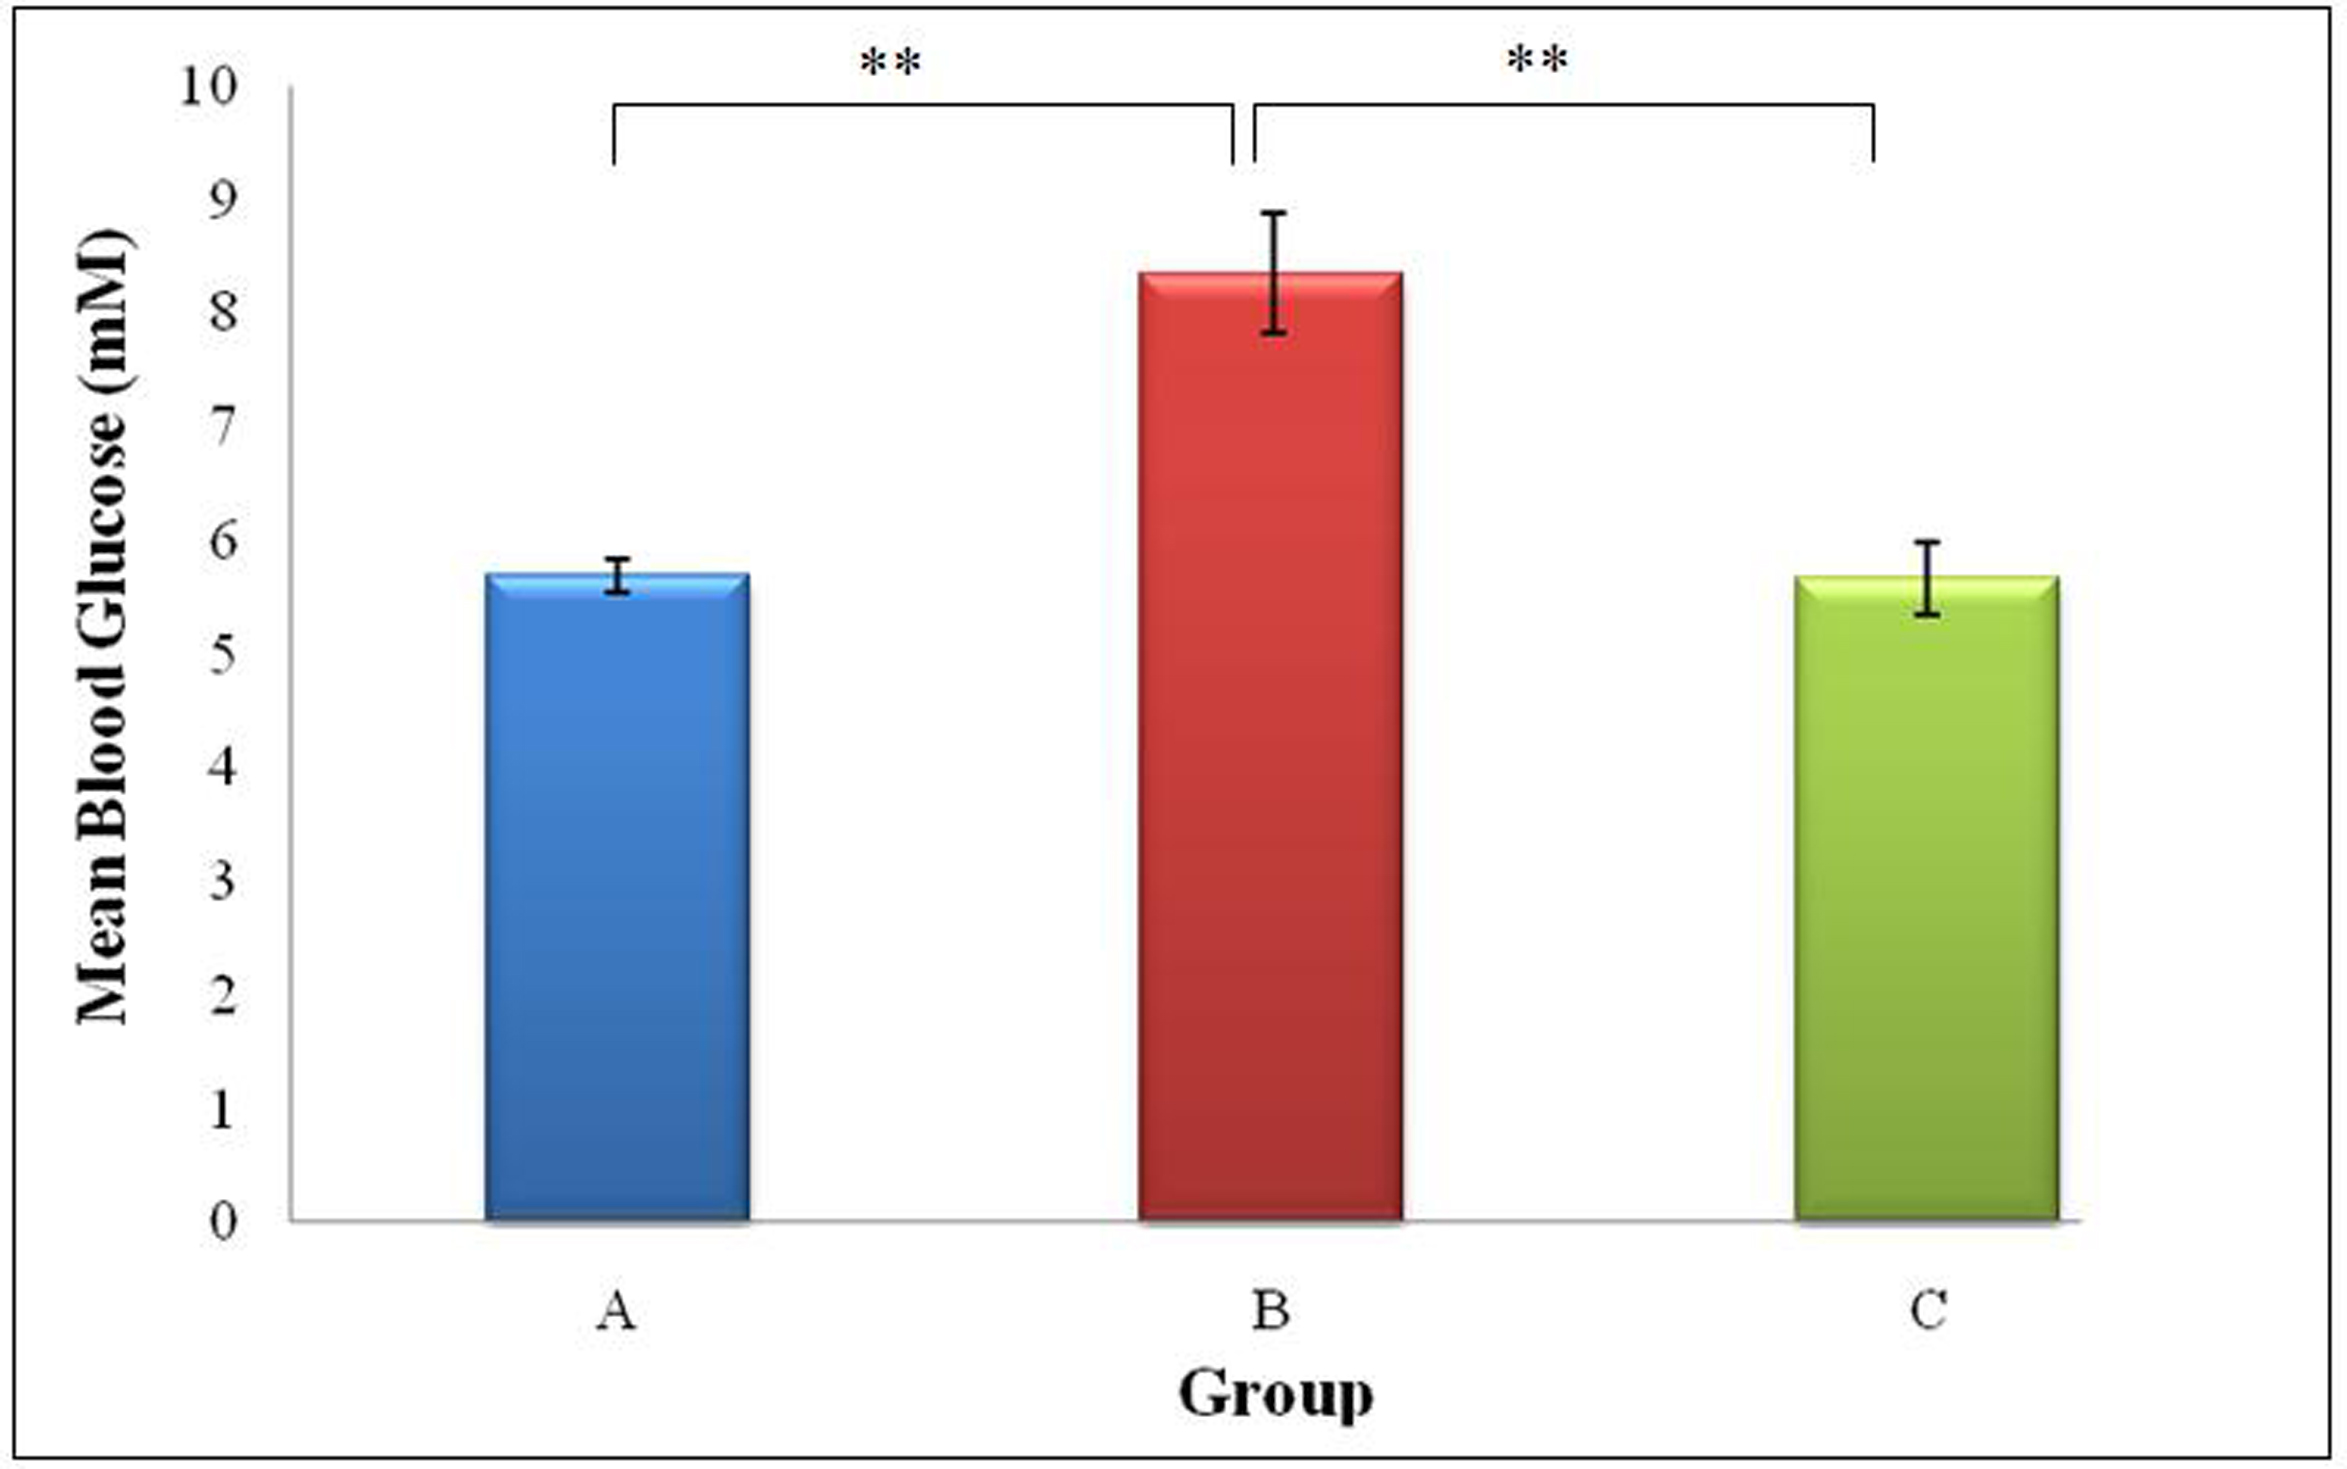
Figure 2. Mean blood glucose concentration (mmol/L) of rats from Groups A, B and C (** indicates P < 0.01 between groups).Group A, Normal Diet; Group B, High-sucrose diet; Group C, High-sucrose diet + GA.
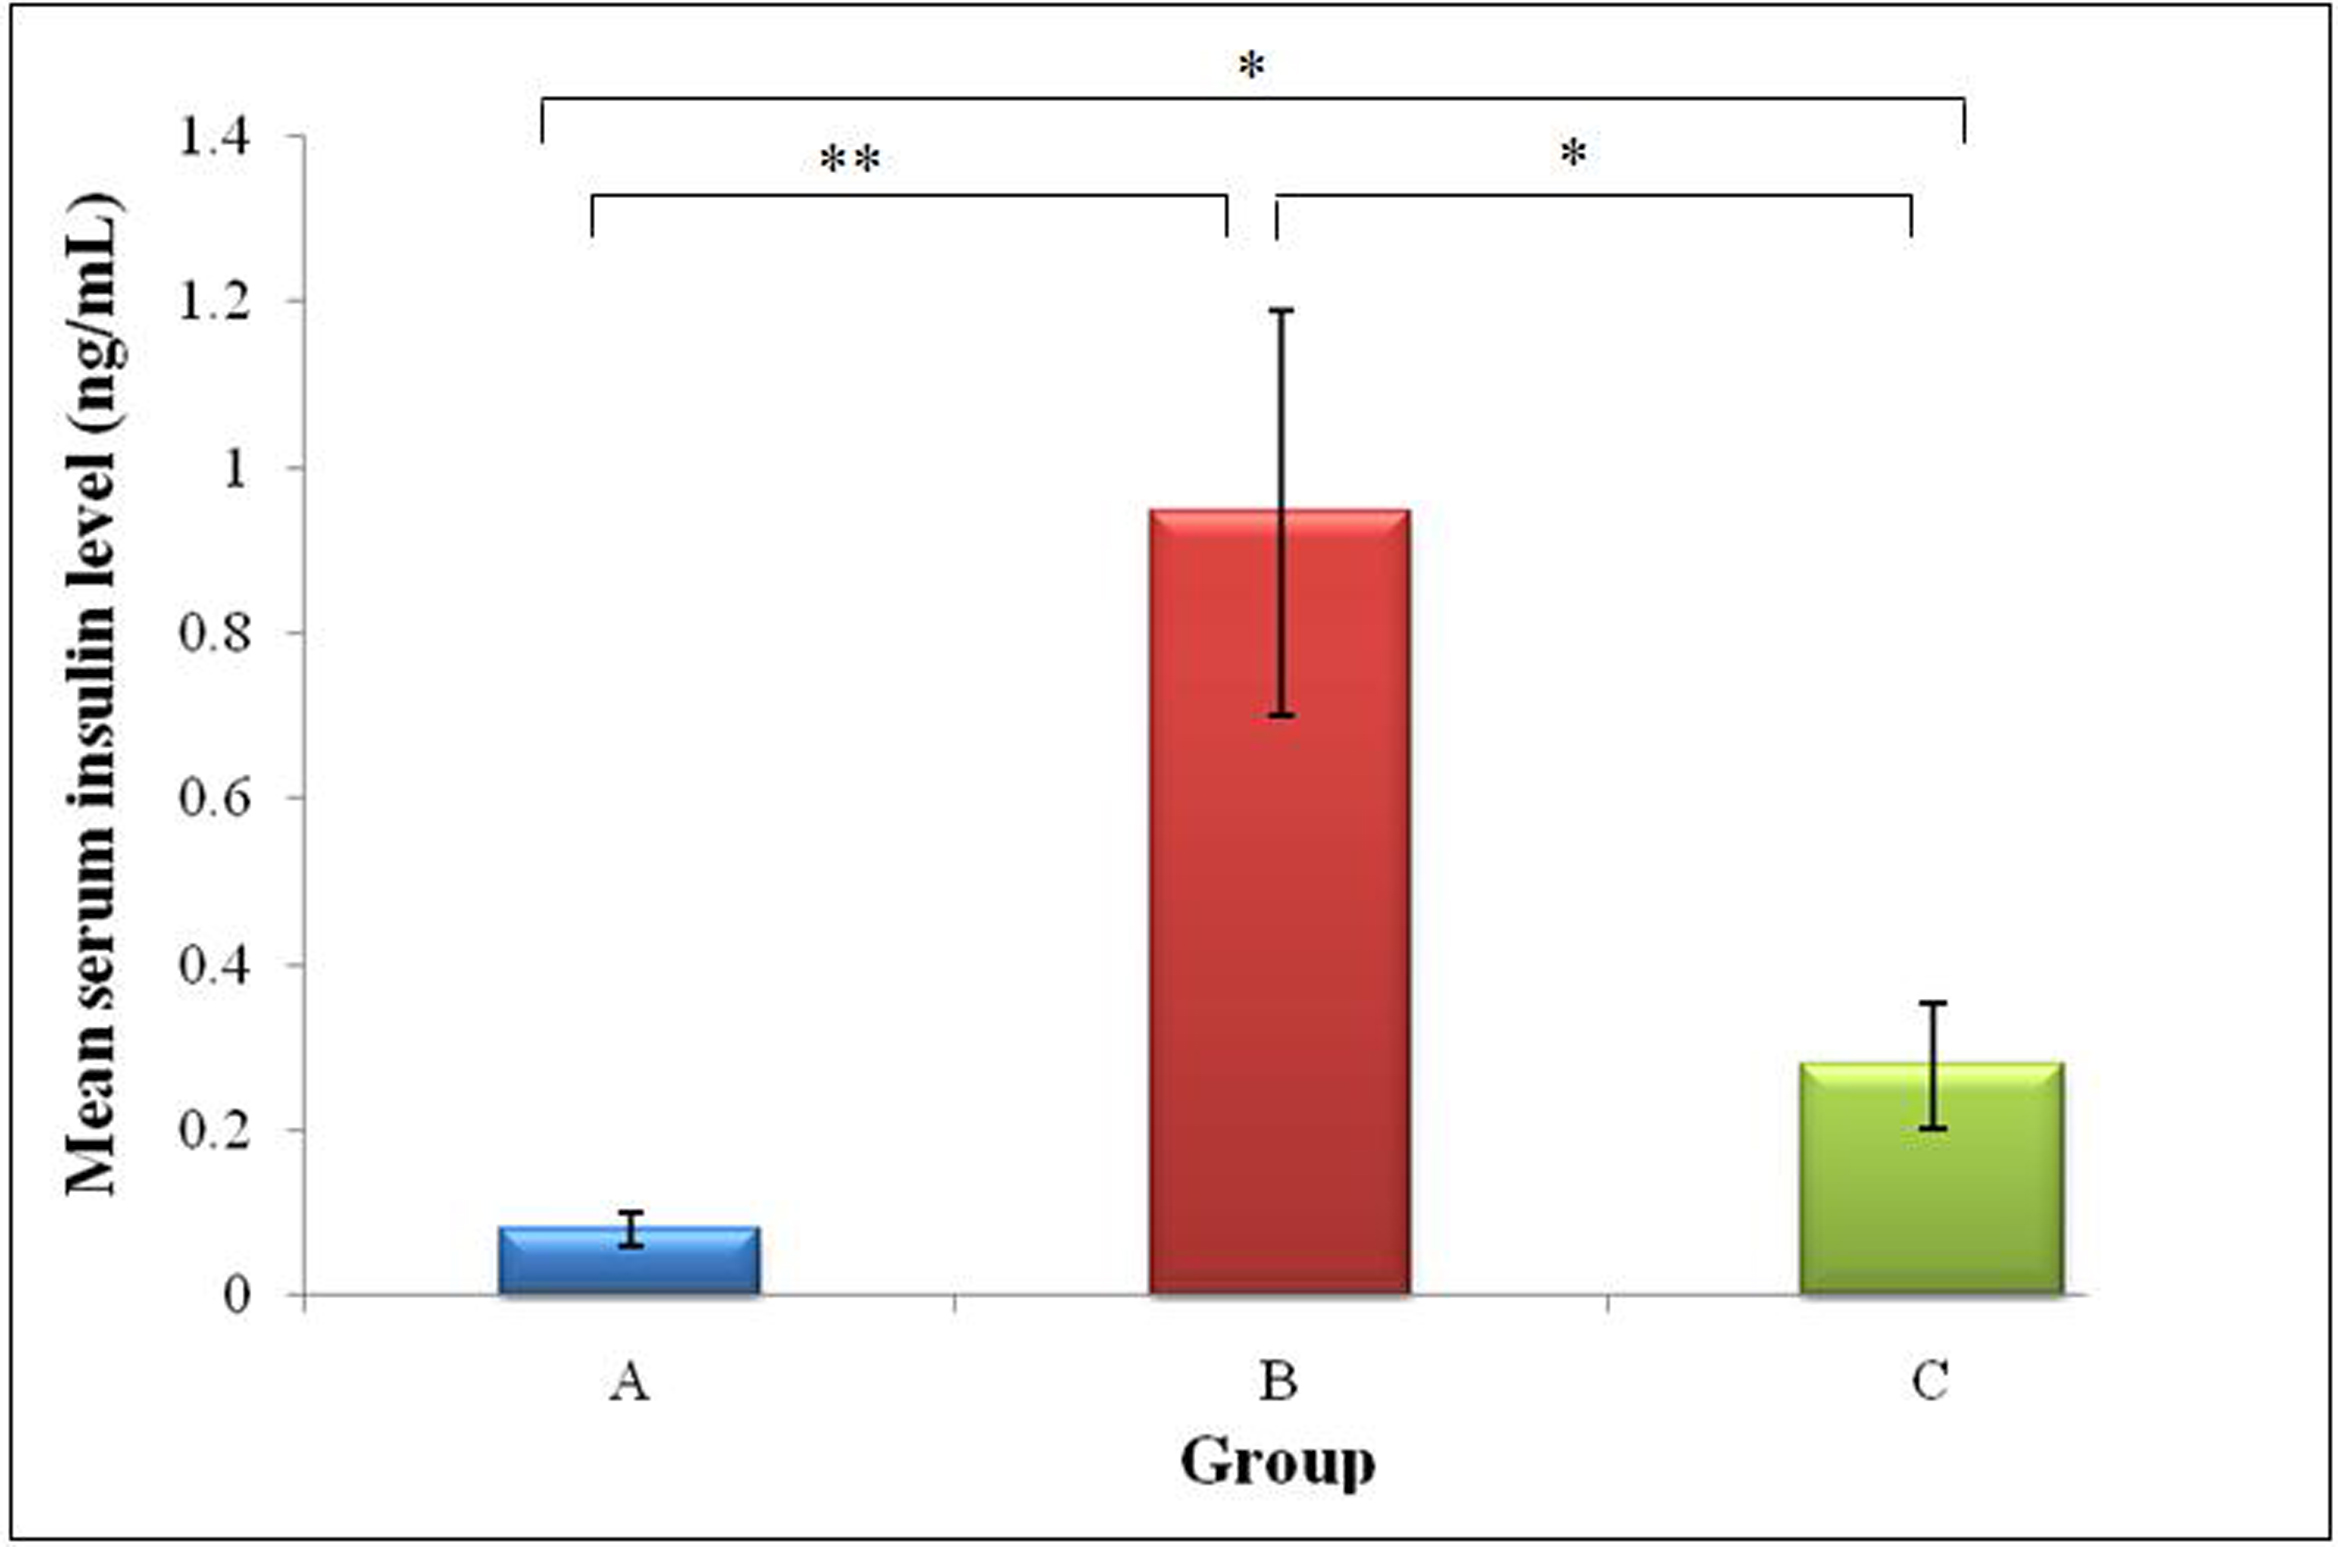
Figure 3. Mean serum insulin (ng/mL) of rats from Groups A, B and C (* indicates P < 0.05 and ** indicates P < 0.01 between groups). Group A, Normal Diet; Group B, High-sucrose diet; Group C, High-sucrose diet + GA.
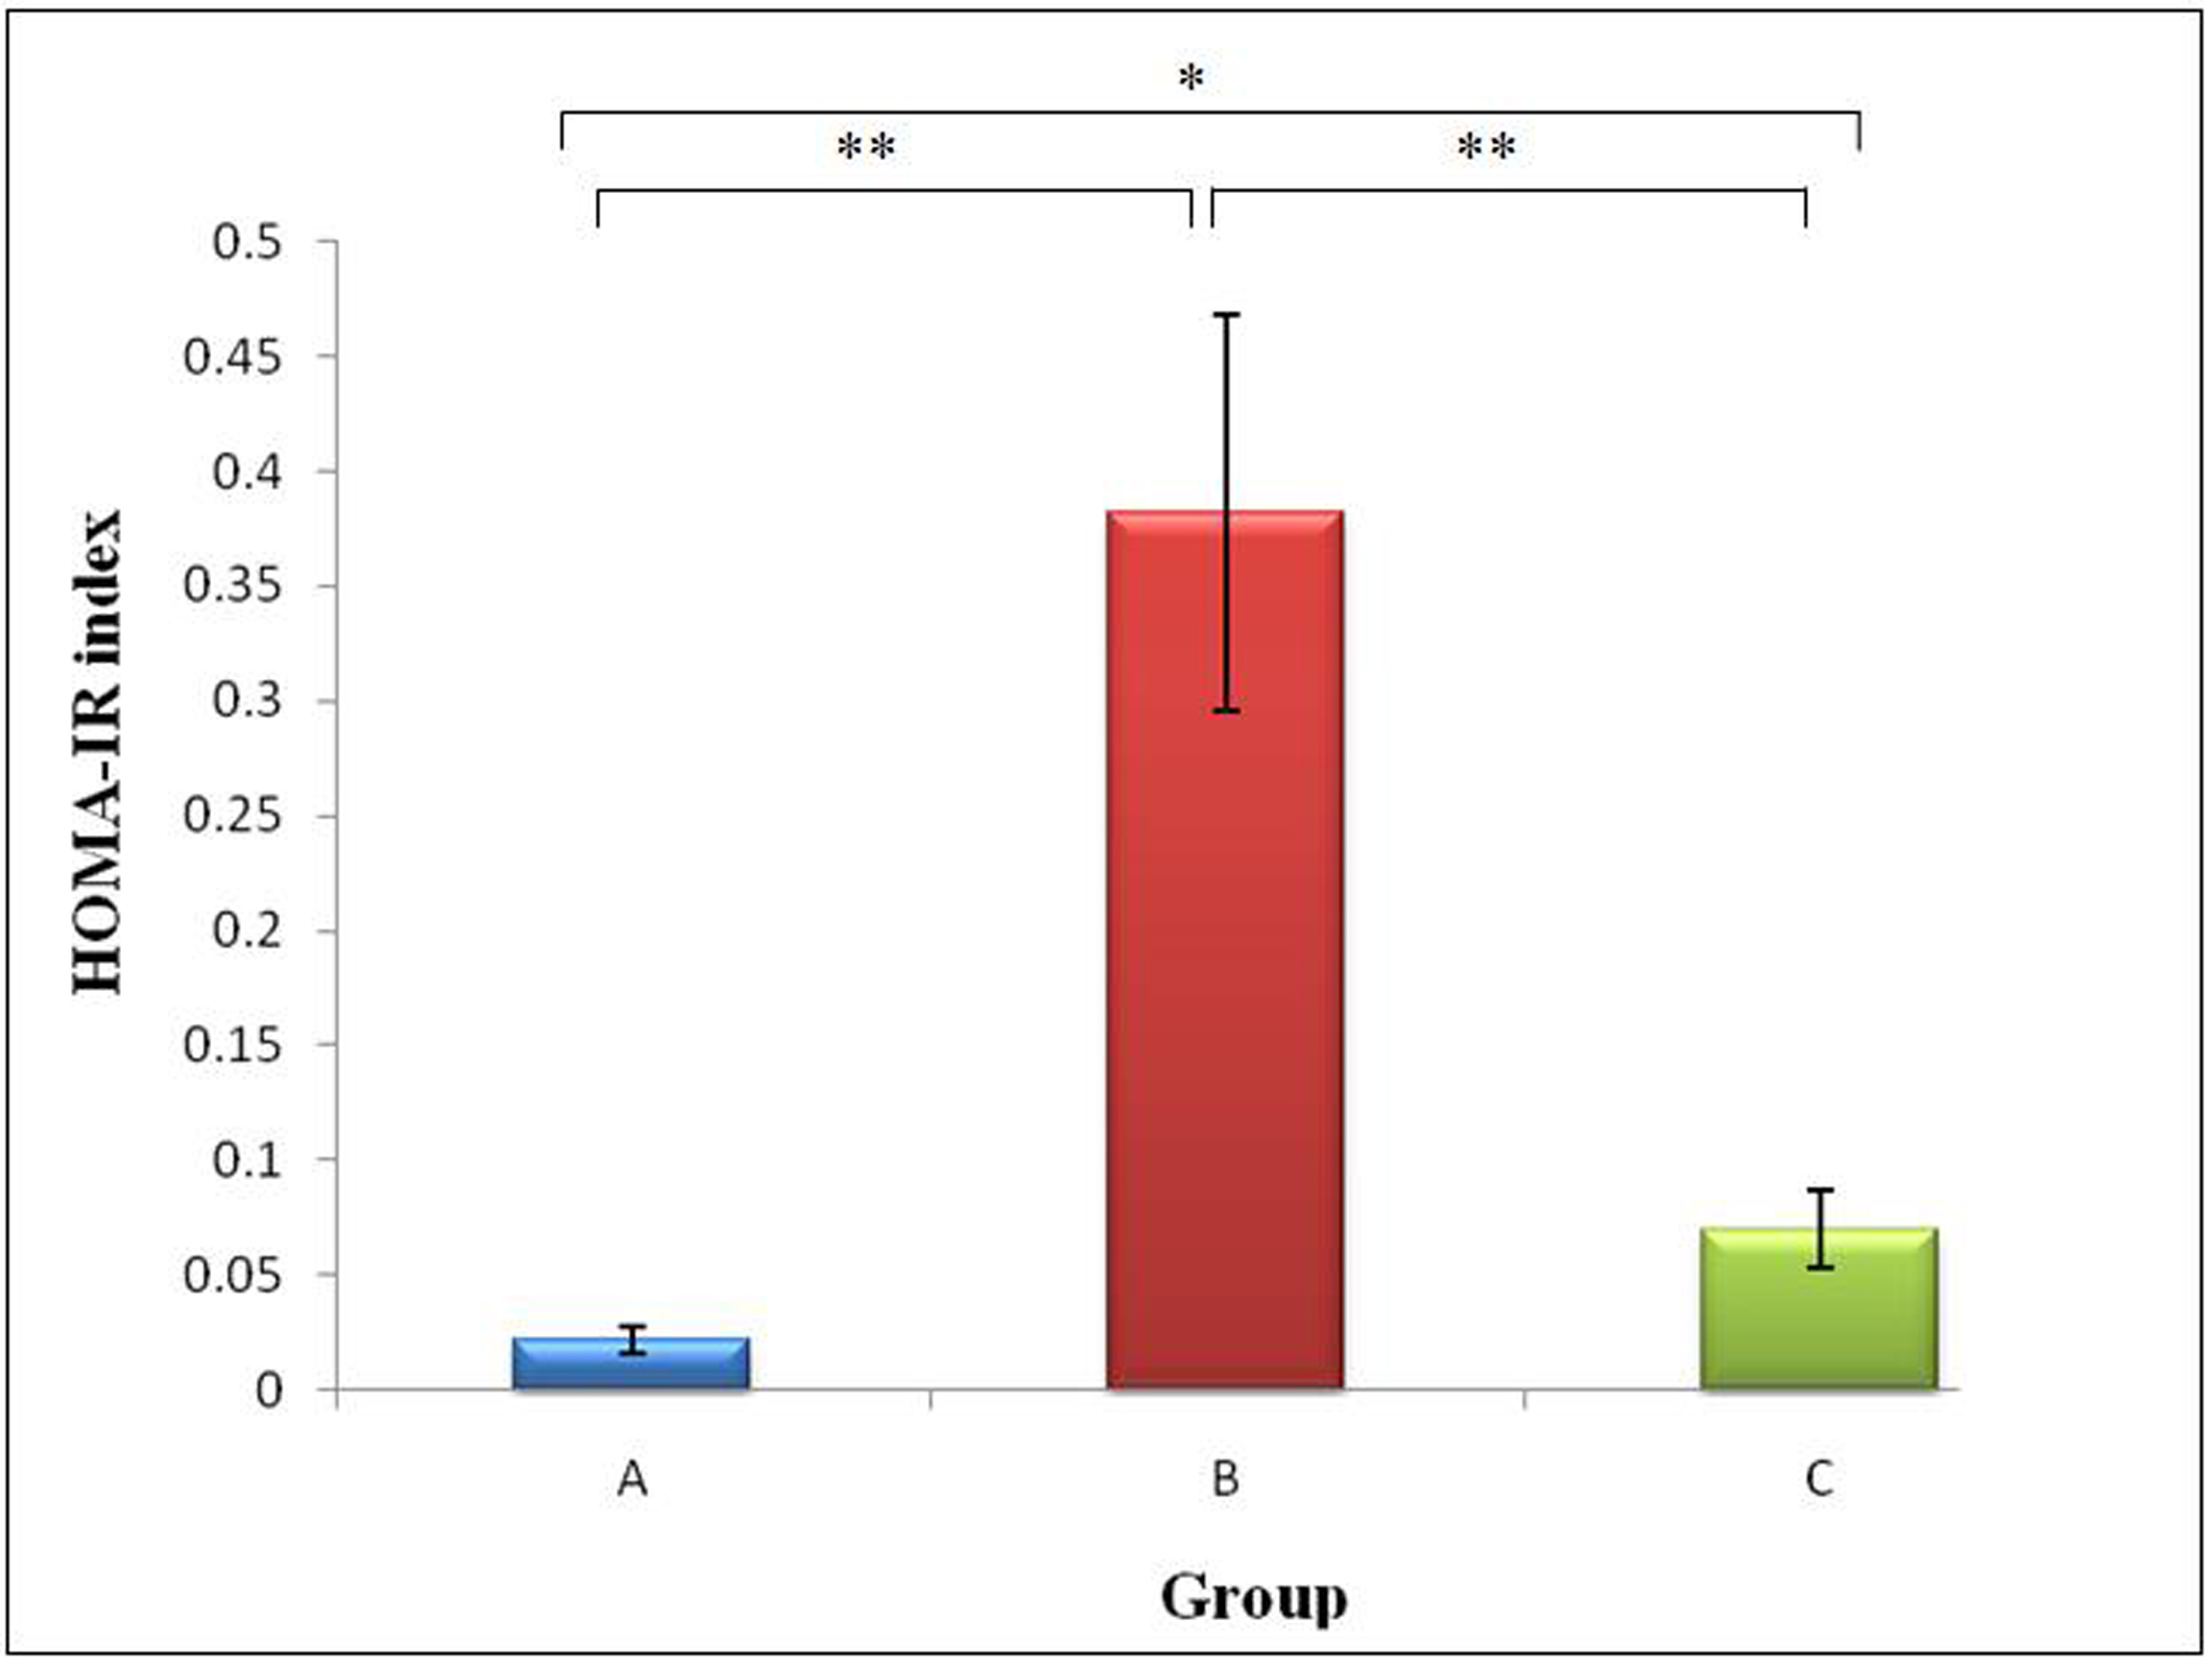
Figure 4. Mean HOMA-IR of rats from Groups A, B and C (* indicates P < 0.05 and ** indicates P < 0.01 between groups).Group A, Normal Diet; Group B, High-sucrose diet; Group C, High-sucrose diet + GA.
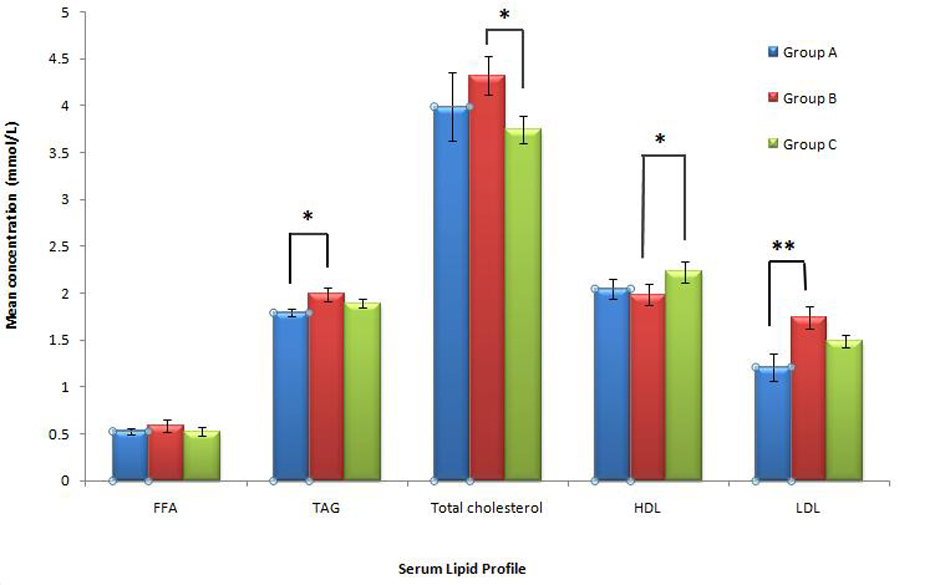
Figure 5. Mean serum free fatty acid (FFA), triglycerides (TAG), total cholesterol, HDL-cholesterol and LDL-cholesterol in rats from Groups A, B and C. (* indicates P< 0.05). Group A, Normal Diet; Group B, High-sucrose diet; Group C, High-sucrose diet + GA.
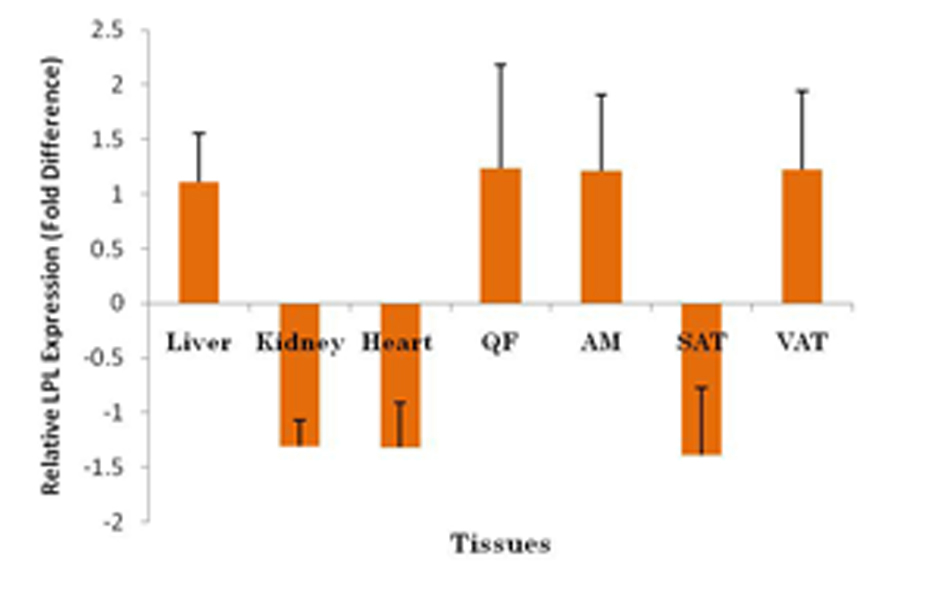
Figure 6. Fold difference of LPL expression in different tissues using BAC as the endogenous reference, tissues from rats fed on normal diet (Group A) as calibrator and tissues from rats fed on high-sucrose diet given GA (Group B) as target. LPL was upregulated in liver, QF, AM and VAT and downregulated in kidney, heart and SAT (P > 0.05). QF, quadriceps femoris; AM, abdominal muscle; SAT, subcutaneous adipose tissue; VAT, visceral adipose tissue; Group A, Normal Diet; Group B, High-sucrose diet; Group C, High-sucrose diet + GA.
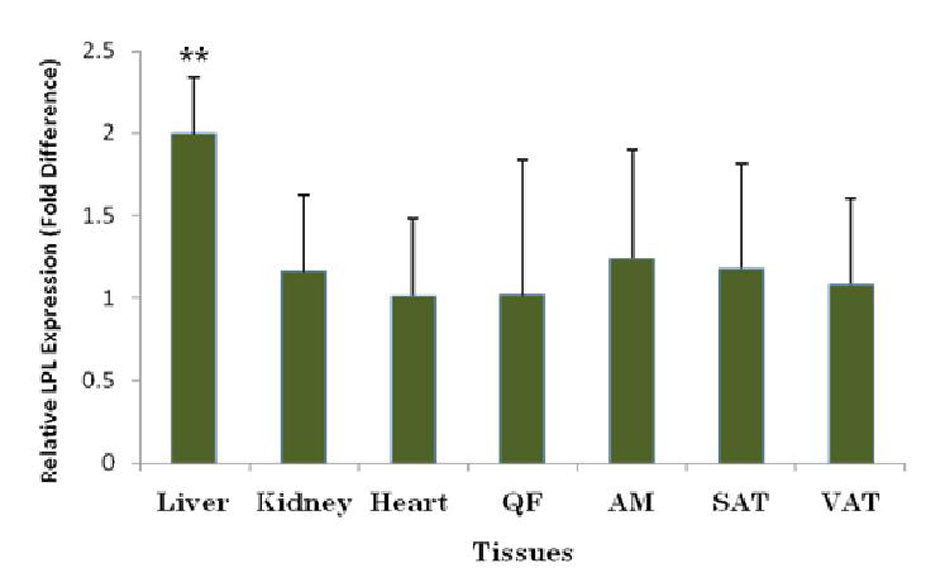
Figure 7. Fold difference of LPL expression in different tissues with BAC as the endogenous reference, tissues from GA-administered high-sucrose-fed group (Group C) as target and tissues from high-sucrose-fed group (Group B) as calibrator. LPL was upregulated in all tissues with significant upregulation in liver. ** indicates P < 0.01. QF, quadriceps femoris; AM, abdominal muscle; SAT, subcutaneous adipose tissue; VAT, visceral adipose tissue; Group A, Normal Diet; Group B, High-sucrose diet; Group C, High-sucrose diet + GA.
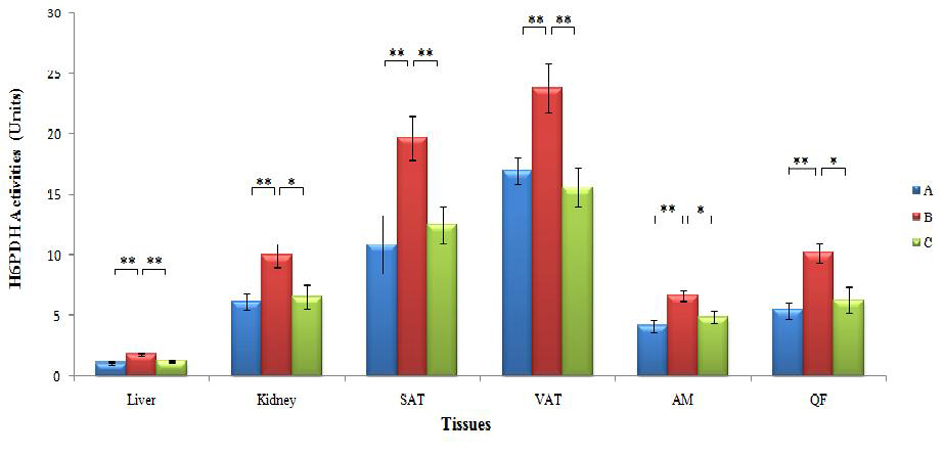
Figure 8. Mean H6PDH activities in the liver, kidneys, SAT, VAT, AM and QF in the three groups of rats (* and ** indicate P < 0.05 and P < 0.01 respectively). H6PDH: hexose-6-phosphate dehydrogenase, SAT: subcutaneous adipose tissue, VAT: visceral adipose tissue, AM: abdominal muscles, QM: quadriceps femoris muscles; Group A, Normal Diet; Group B, High-sucrose diet; Group C, High-sucrose diet + GA.
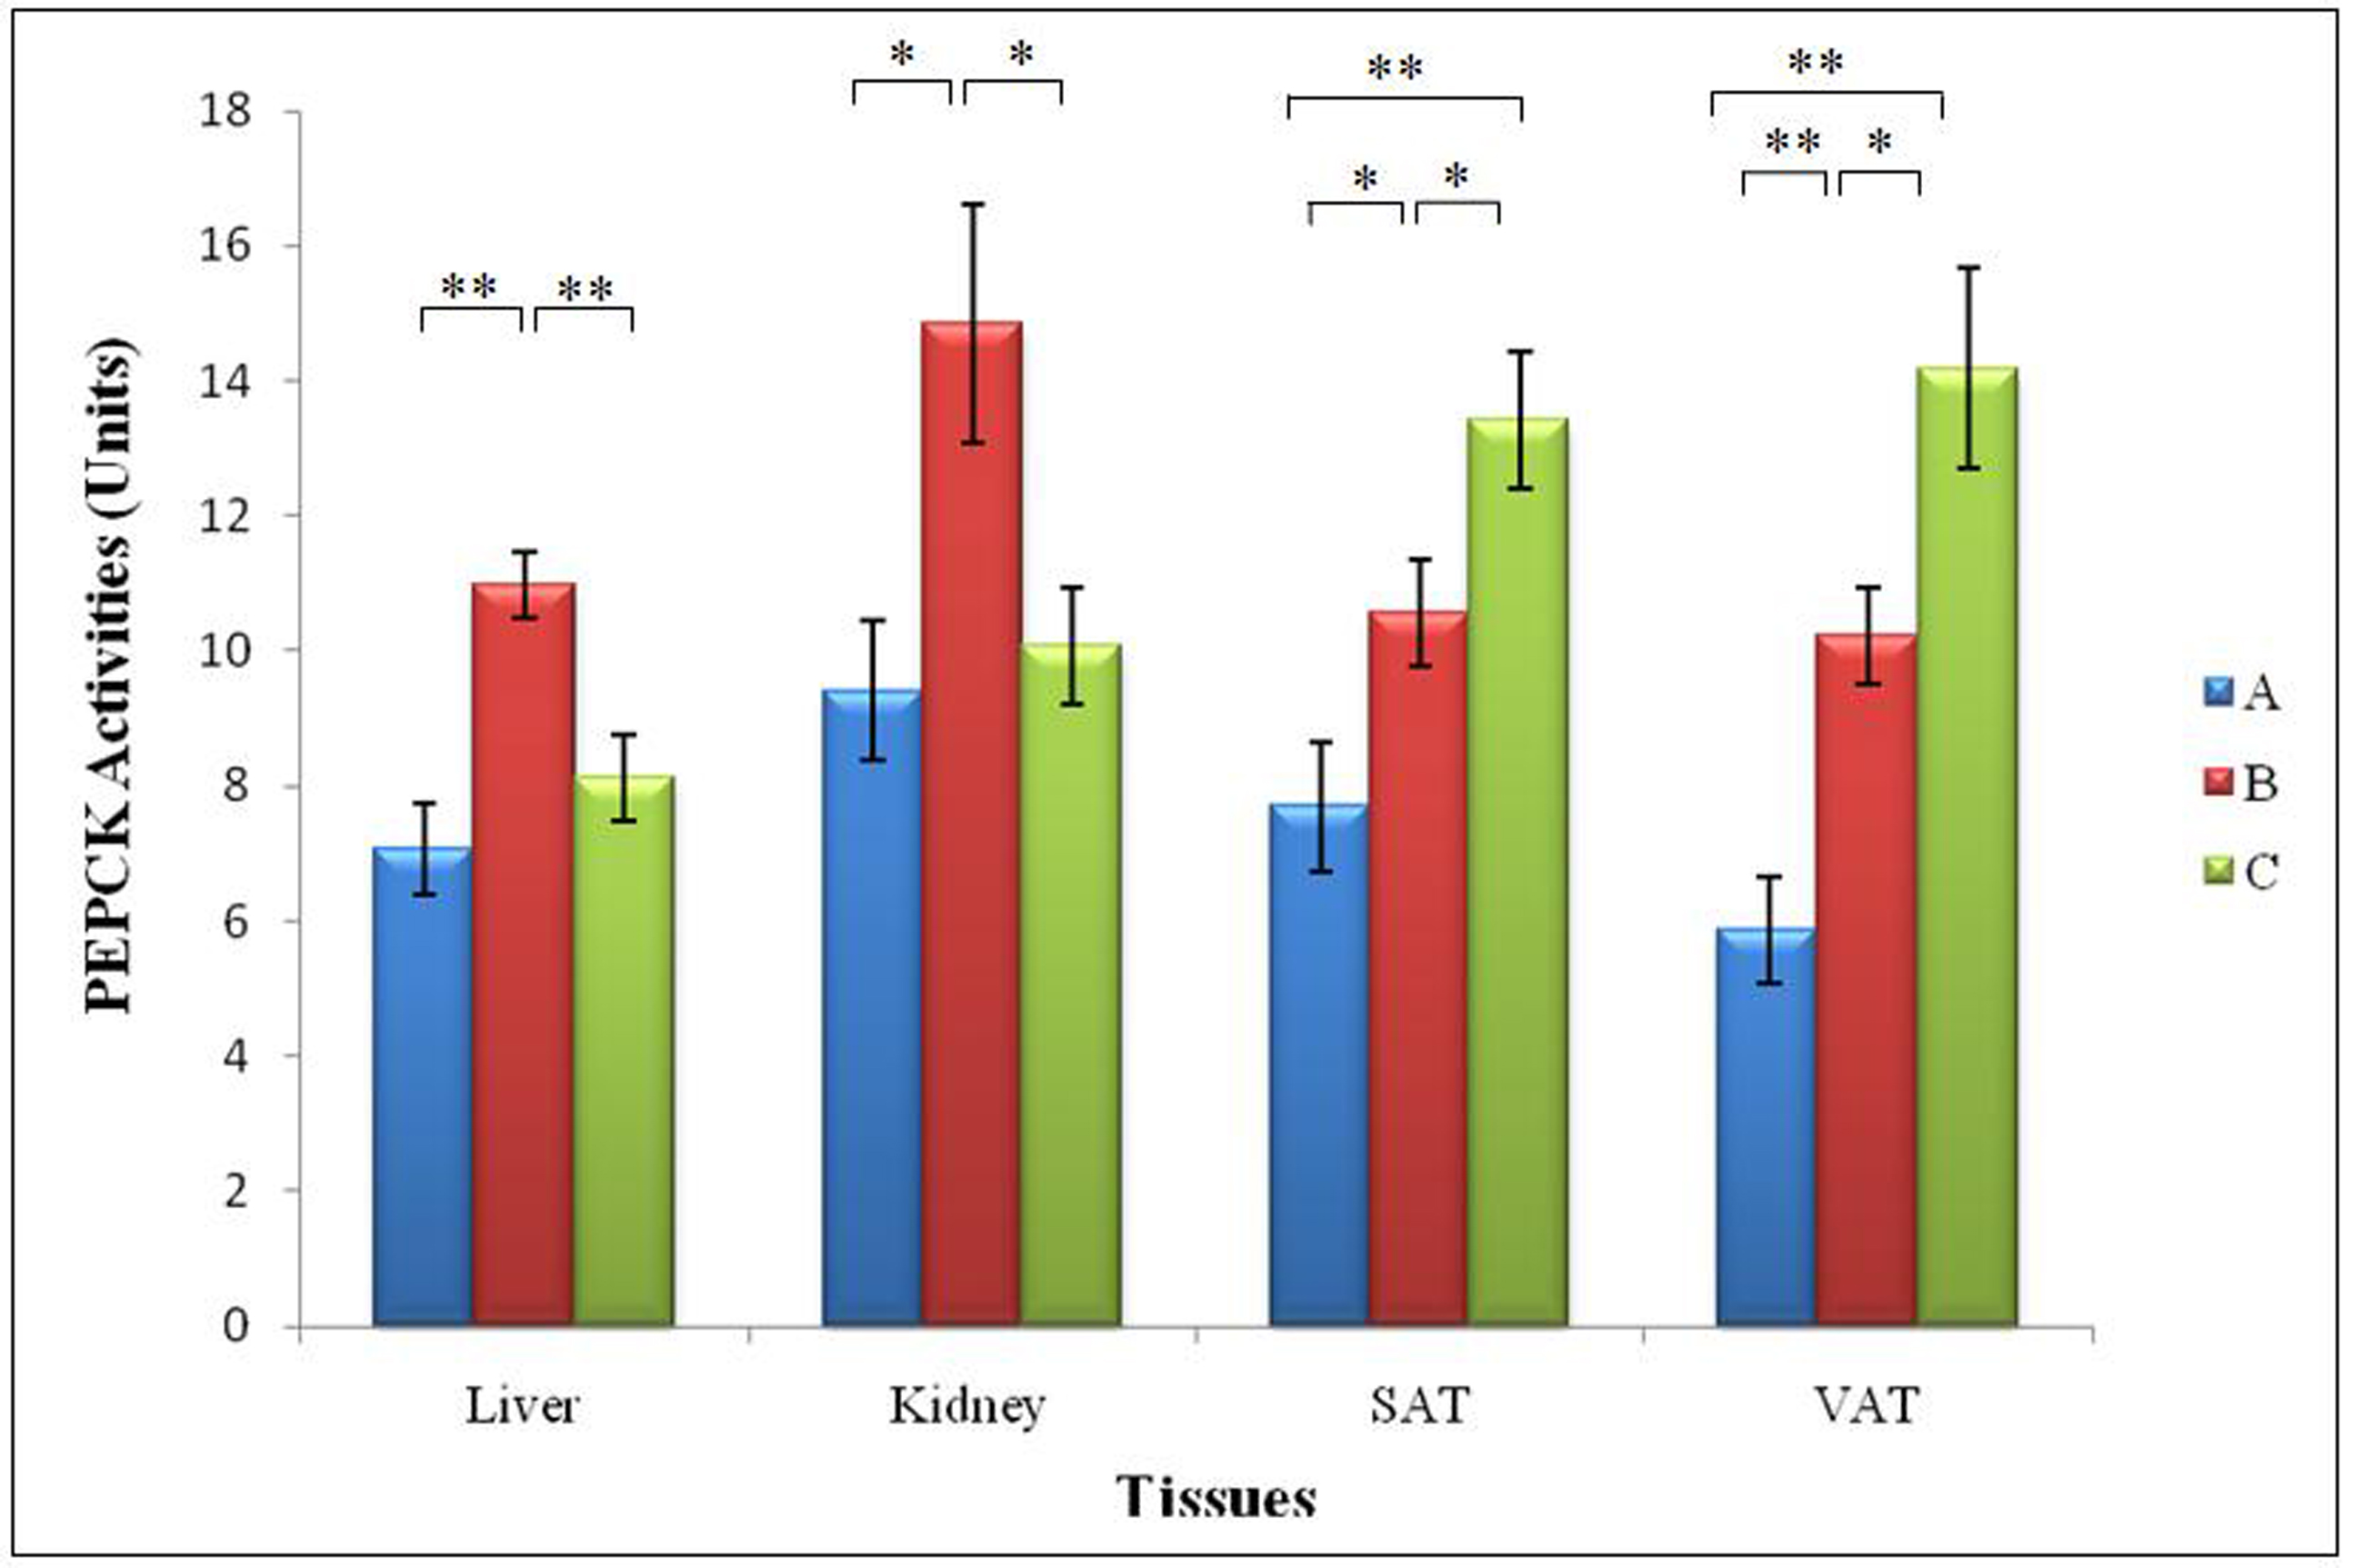
Figure 9. Mean PEPCK activities in the liver, kidneys, SAT and VAT in the three groups of rats. (* and ** indicate P < 0.05 and P < 0.01 respectively). PEPCK: phosphoenolpyruvate carboxykinase, SAT: subcutaneous adipose tissue, VAT: visceral adipose tissue;Group A, Normal Diet; Group B, High-sucrose diet; Group C, High-sucrose diet + GA.
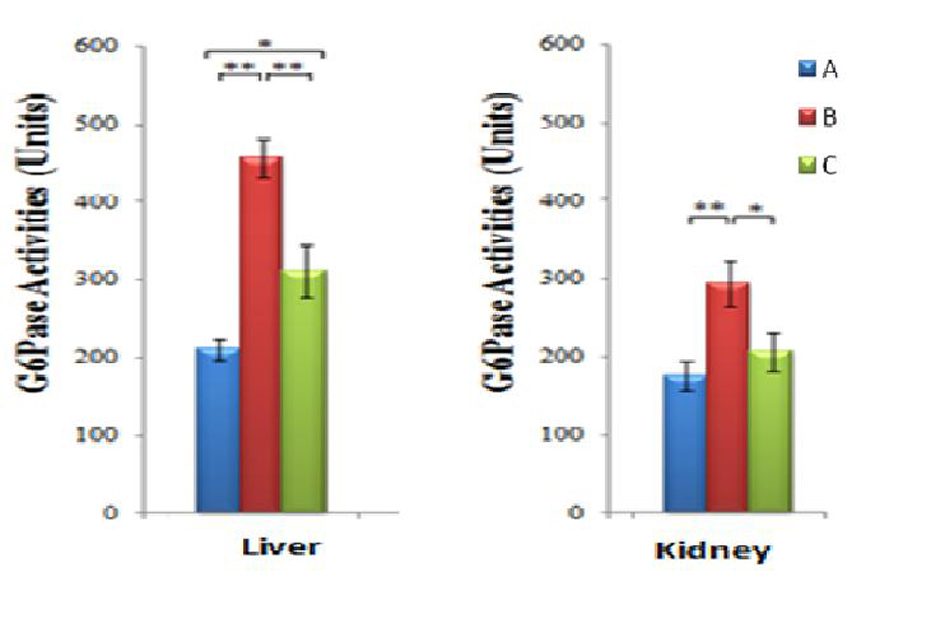
Figure 10. Mean G6Pase activities in kidney and liver of the three groups of rats (* and ** indicate P ≤ 0.05 and P ≤ 0.01 respectively). G6Pase: glucose-6-phosphatase; Group A, Normal Diet; Group B, High-sucrose diet; Group C, High-sucrose diet + GA.
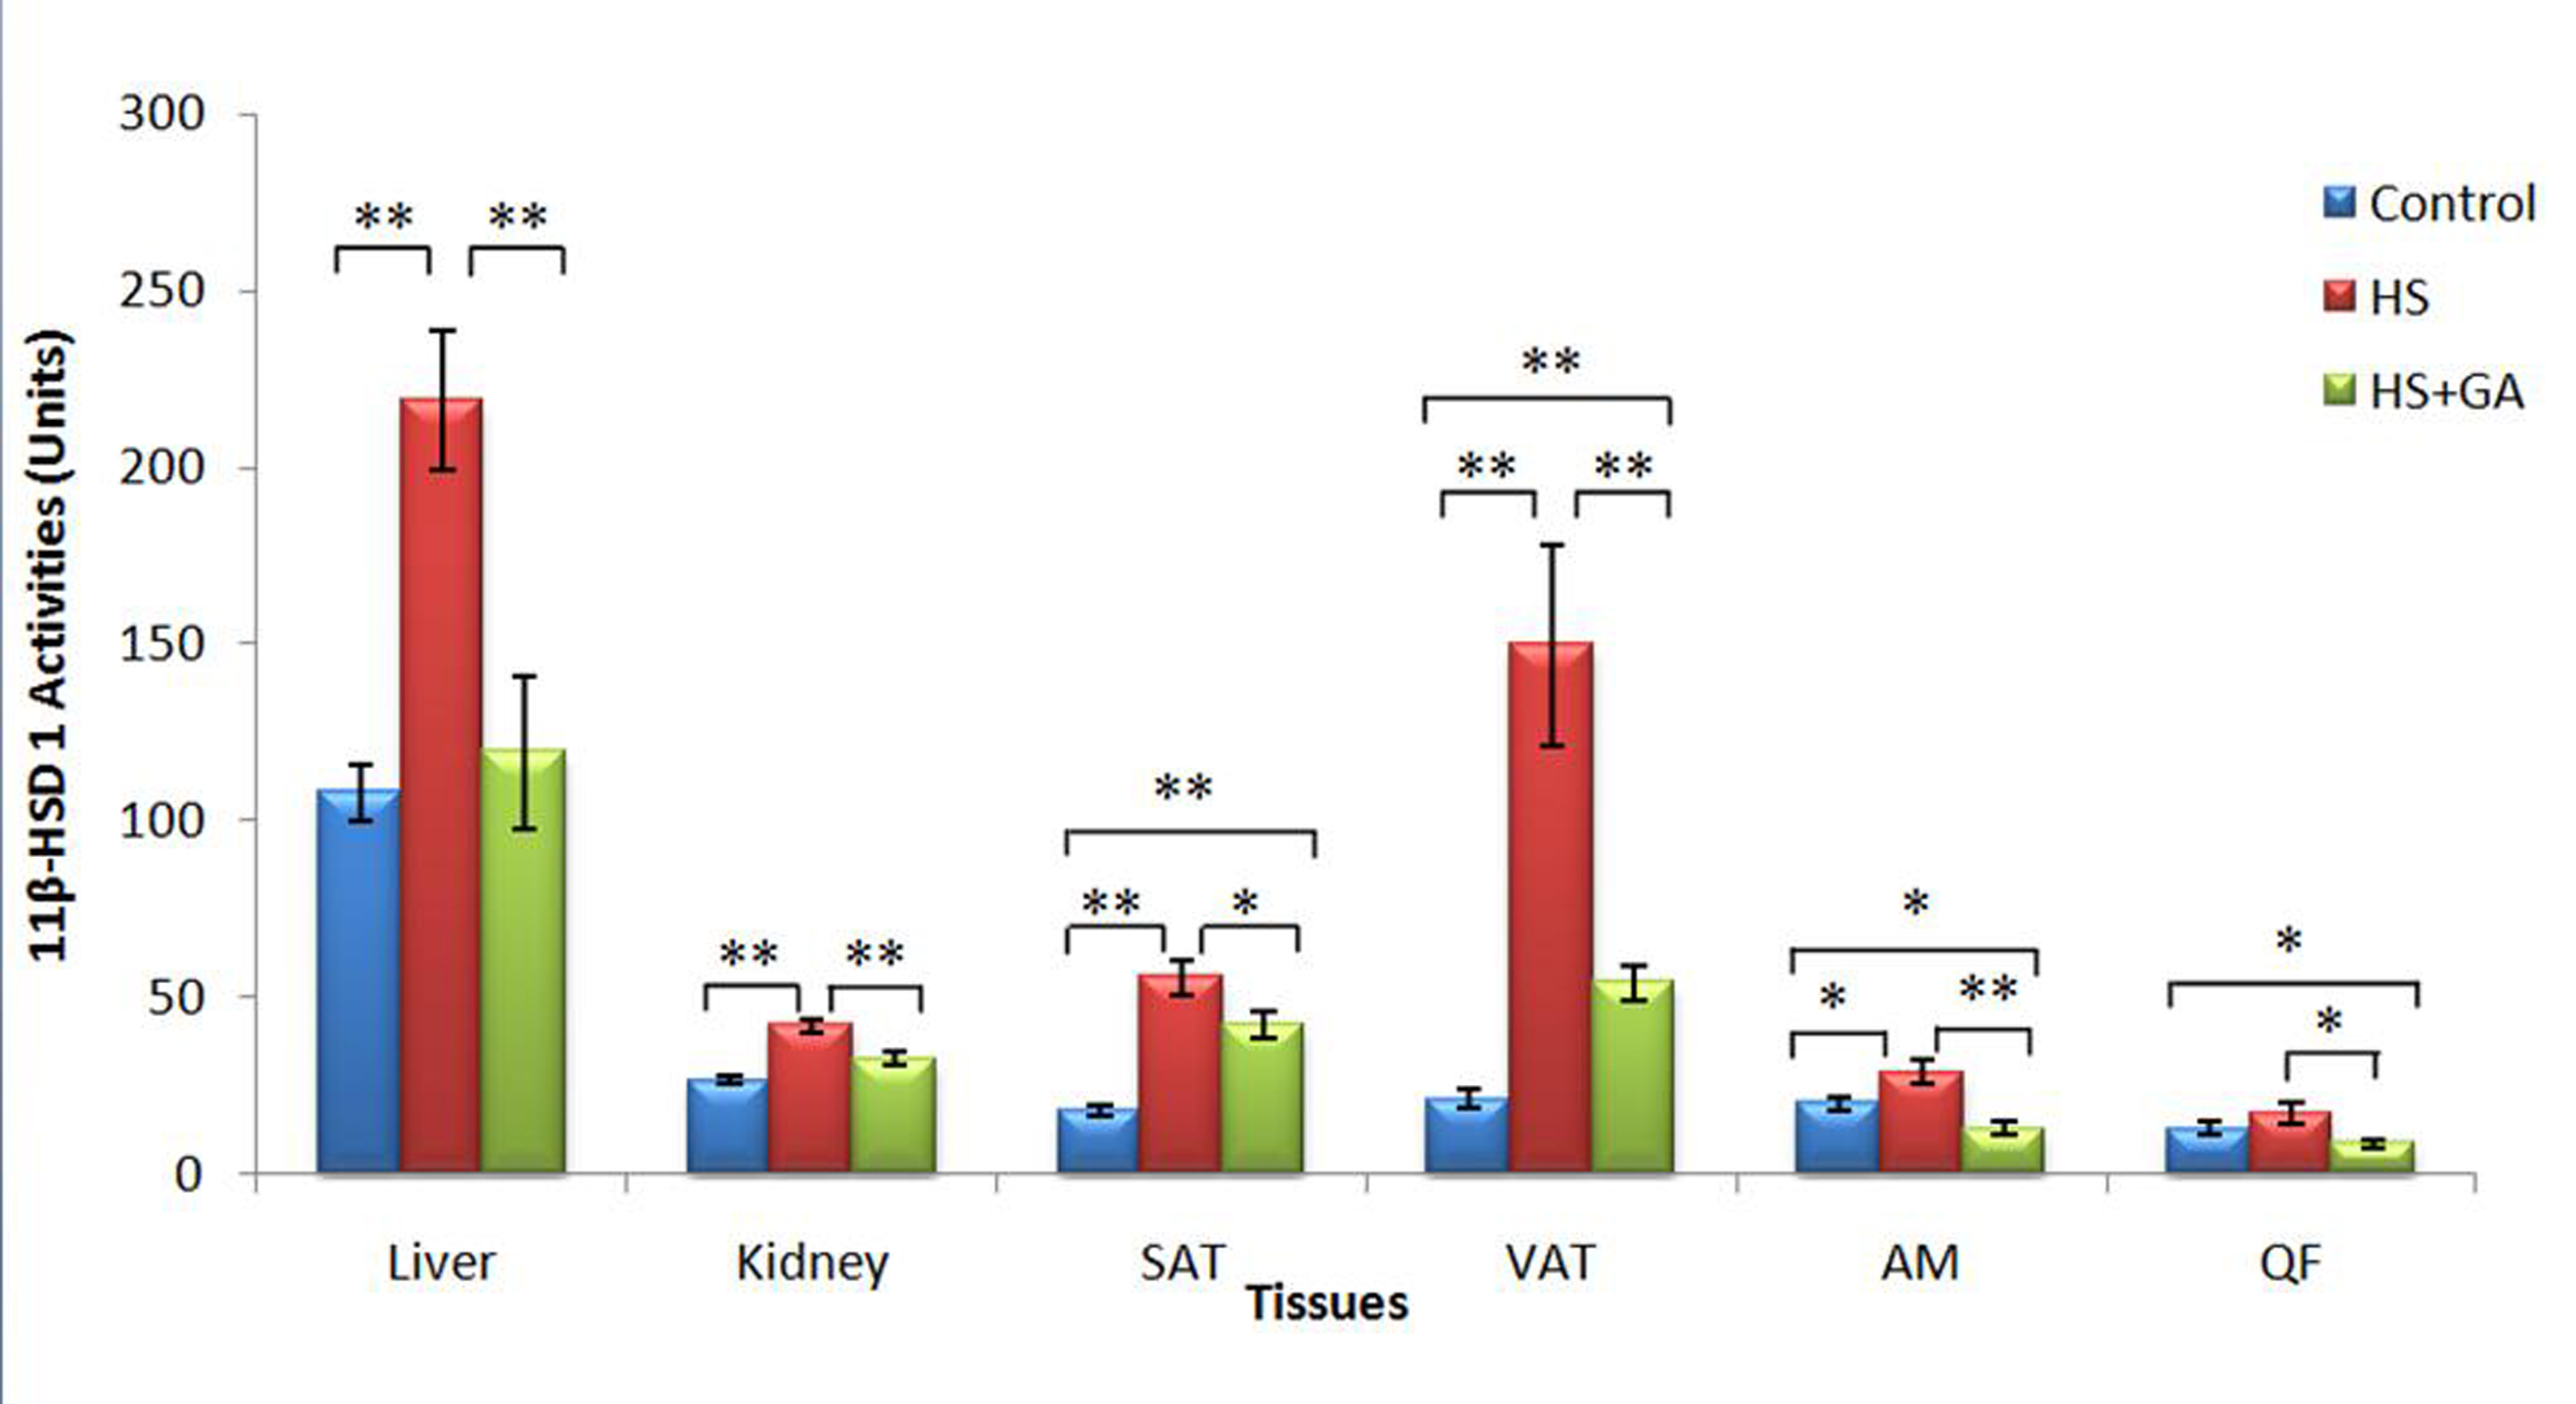
Figure 11. Summary of enzyme activities of 11β-HSD 1 in all tissues of the three experimental groups of rats over the 4-weeks treatment period. (* indicates P ≤ 0.05, ** indicates P ≤ 0.01 respectively).Group A, Normal Diet; Group B, High-sucrose diet; Group C, High-sucrose diet + GA.