Journal of Endocrinology and Metabolism, ISSN 1923-2861 print, 1923-287X online, Open Access
Article copyright, the authors; Journal compilation copyright, J Endocrinol Metab and Elmer Press Inc
Journal website http://www.jofem.org

Case Report

Volume 6, Number 5, October 2016, pages 162-164


Cerebral Venous Sinus Thrombosis in a Patient With Graves’ Disease

Figures

Figure 1.
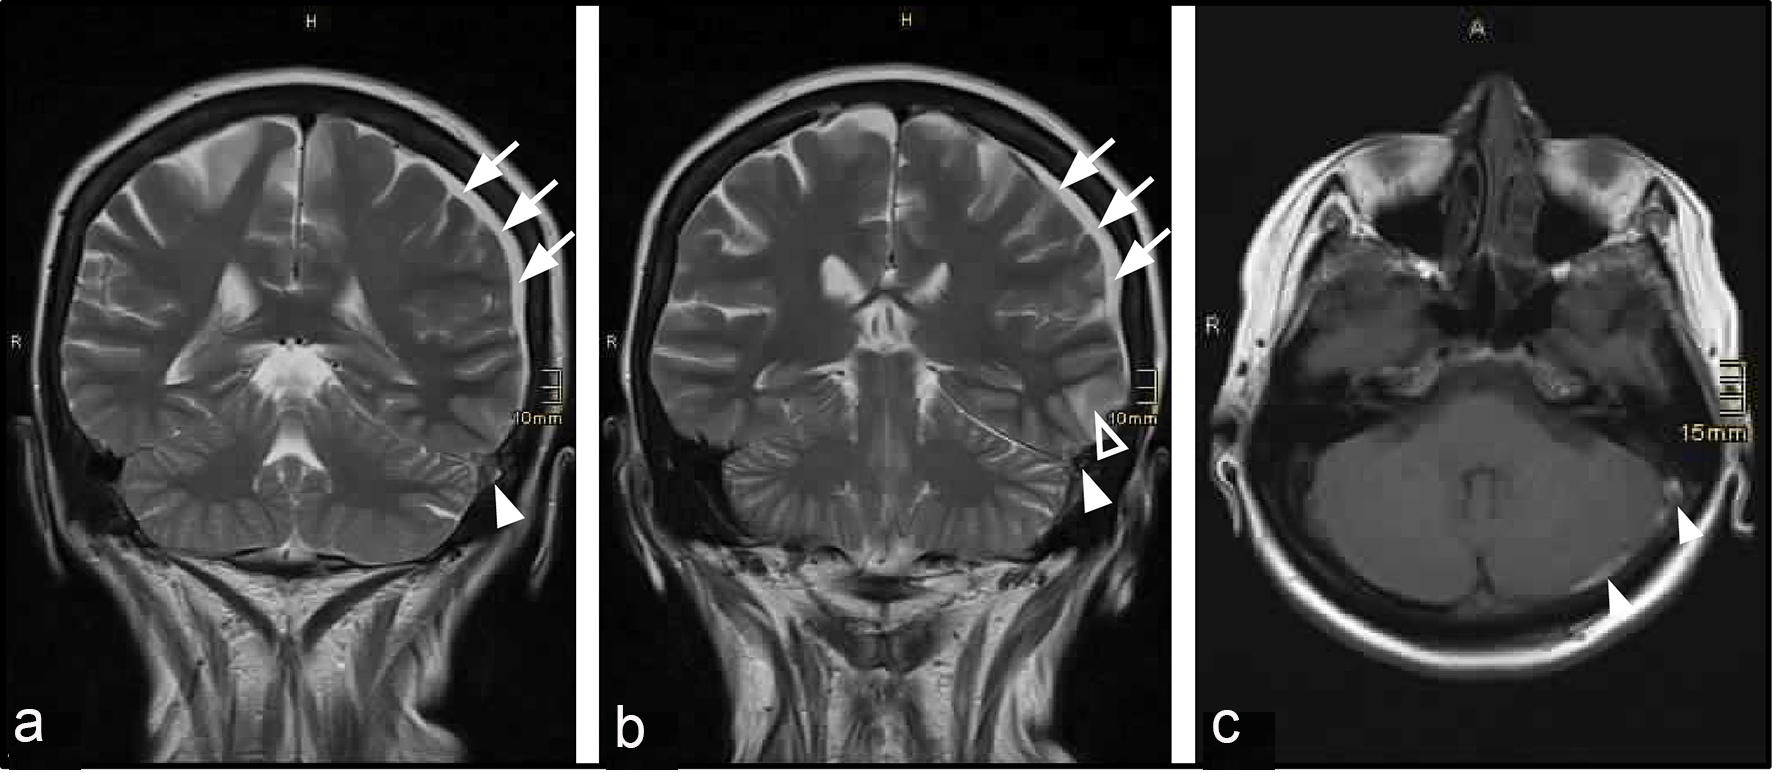
Figure 1. Detection of CVST by cranial MRI. (a, b) T2-weighed MRI, coronal section. (c) Gadolinium-enhanced T1-weighed image, axial section. Filled arrowheads show thrombus in the left transverse and sigmoid sinus. Blank arrowhead shows left temporal intracerebral hemorrhage. Arrows show left parietal subdural hematoma.
Figure 2.
Figure 2. Sonography of the thyroid gland shows hyperperfusion of the thyroid parenchyma, consistent with the diagnosis of Graves’ disease. Volume measurement revealed normal thyroid size (v = 16.6 mL, norm: up to 18 mL).

Table

Table 1. Lab Parameters Indicative of Graves’ Disease, and Their Course During Therapy
 
ParameterReferenceAdmissionCourse 1Course 2Discharge
Course 1: 4 days after starting thyrostatic therapy. Course 2: 7 days after starting thyrostatic therapy. Discharge: 12 days after starting thyrostatic therapy.
TSH (µU/mL)0.27 - 4.20< 0.014< 0.014
T3 (pmol/L)3.4 - 6.825.847.815.925.97
T4 (pmol/L)10.6 - 22.761.329.820.914.5
TSI (IU/L)< 1.7526.84
Anti-TPO (IU/mL)< 3482.0
Functional protein C (%)70 - 13447