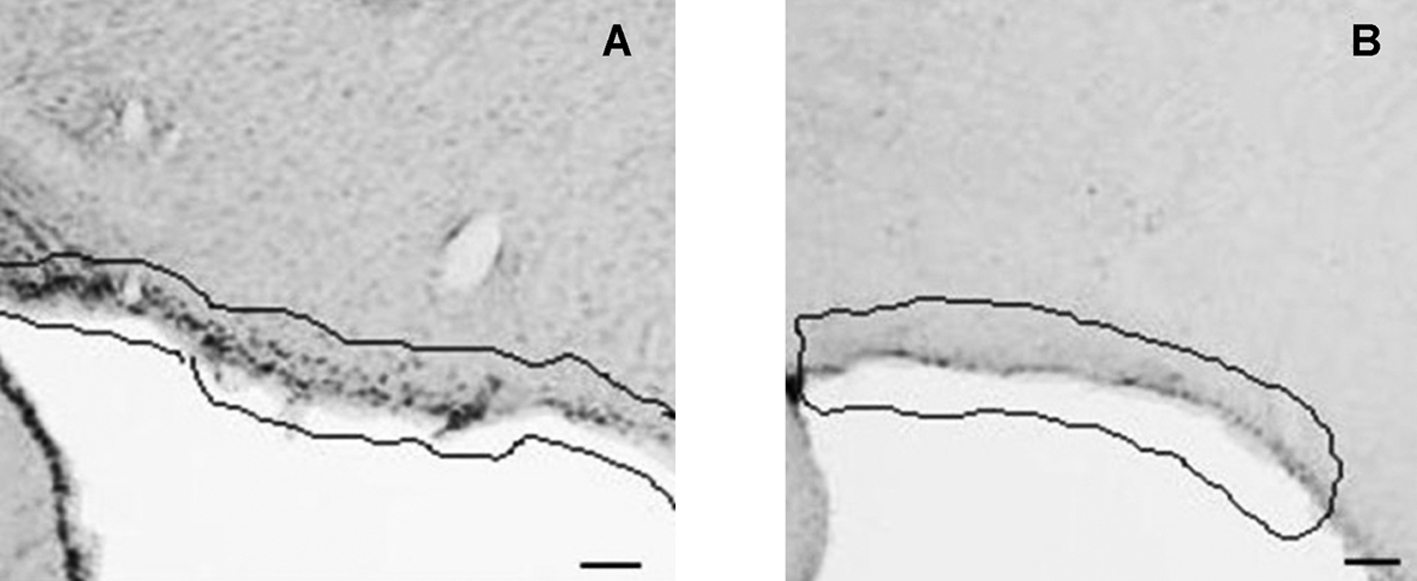
Figure 1. CD26 immunoreactivity in coronal section of rat brain. Pia mater (highlighted) of control (A) and food deprived MSG (B) animals. 2.12 mm posterior to bregma. Bars = 30µm.
| Journal of Endocrinology and Metabolism, ISSN 1923-2861 print, 1923-287X online, Open Access |
| Article copyright, the authors; Journal compilation copyright, J Endocrinol Metab and Elmer Press Inc |
| Journal website http://www.jofem.org |
Original Article
Volume 1, Number 2, June 2011, pages 79-86
Hypothalamic Dynamics of CD26 Protein in Obese and Fasted Rats
Figures
Tables
| Regions | C | FD | MSG | MSG-FD |
|---|---|---|---|---|
| Values are mean ± SEM. Number of animals in the parentheses. A = absence of immunoreactivity. *P < 0.05, **P < 0.009 and ***P < 0.0001 compared to C (paired, two-sided Student’s t test). ArcNH: arcuate nucleus hypothalamic; DMH: dorsomedial hypothalamus; Pe: periventricular hypothalamic nucleus; PVN: paraventricular hypothalamic nucleus; RCh: retrochiasmatic hypothalamic nucleus; SON: supraoptic hypothalamic nucleus; PM: pia mater.#Reference of localization in mm posterior to the bregma [24]. | ||||
| ArcNH (1.71 - 4.36 mm)# | 306 ± 11.26 (3) | 490 ± 33.77** (3) | 144 ± 15.88** (3) | 292 ± 26.56 (3) |
| DMH (2.28 - 3.84 mm)# | 14 ± 0.88 (3) | 27 ± 1.45** (3) | 10 ± 1.15 (3) | A (3) |
| Pe (1.32 - 3.48 mm)# | 63 ± 12.12 (3) | 134 ± 19.63* (3) | 52 ± 9.81 (3) | 144 ± 24.26* (3) |
| PM (1.32 - 4.36 mm)# | 425 ± 37.58 (3) | 58 ± 7.22*** (3) | 256 ± 20.71* (3) | 51 ± 5.19*** (3) |
| PVN (1.32 - 2.28 mm)# | 47 ± 4.91 (3) | 88 ± 6.93** (3) | A (3) | A (3) |
| RCh (1.32 - 2.52 mm)# | 12 ± 1.15 (3) | 41 ± 7.8* (3) | 138 ± 11.14*** (3) | A (3) |
| SON (1.32 - 2.52 mm)# | 8 ± 1.45 (3) | A (3) | 79 ± 1.45*** (3) | A (3) |
| Regions | C | FD | MSG | MSG-FD |
|---|---|---|---|---|
| Values are mean ± SEM. Number of animals in the parentheses. A = absence of immunoreactivity. *P < 0.05, **P < 0.009 and ***P < 0.0006 compared to C (paired, two-sided Student’s t test). AH: anterior hypothalamus; ArcNH: arcuate hypothalamic nucleus; DMH: dorsomedial hypothalamus; Pe: periventricular hypothalamic nucleus; PVN: paraventricular hypothalamic nucleus; RCh: retrochiasmatic hypothalamic nucleus; SON: supraoptic hypothalamic nucleus; VMH: ventromedial hypothalamus. #Reference of localization in mm posterior to the bregma [24]. | ||||
| AH (1.32 – 2.82)# | 63 ± 11.83 (3) | 51 ± 9.52 (3) | 27 ± 4.91* (3) | 60 ± 6.64 (3) |
| ArcNH (1.71 – 4.36)# | 437 ± 66.11 (3) | 352 ± 31.46 (3) | 347 ± 61.77 (3) | 101 ± 23.67** (3) |
| DMH (2.28 – 3.84)# | 577 ± 111.14 (3) | 443 ± 69 (3) | 12 ± 2.31** (3) | 239 ± 41.28* (3) |
| Pe (1.32 – 3.48)# | 120 ± 16.45 (3) | 78 ± 4.91 (3) | 16 ± 1.15** (3) | 16 ± 2.03** (3) |
| PVN (1.32 – 2.28)# | 207 ± 16.16 (3) | 135 ± 14.14* (3) | 66 ± 7.50** (3) | 30 ± 4.61*** (3) |
| RCh (1.32 – 2.52)# | 155 ± 19.92 (3) | 65 ± 7.50* (3) | 22 ± 4.04** (3) | 66 ± 11.26* (3) |
| SON (1.32 – 2.52)# | 25 ± 2.60 (3) | A (3) | A (3) | A (3) |
| VMH (1.72 – 3.36)# | 408 ± 79.67 (3) | 74 ± 12.70* (3) | A (3) | 118 ± 21.94* (3) |