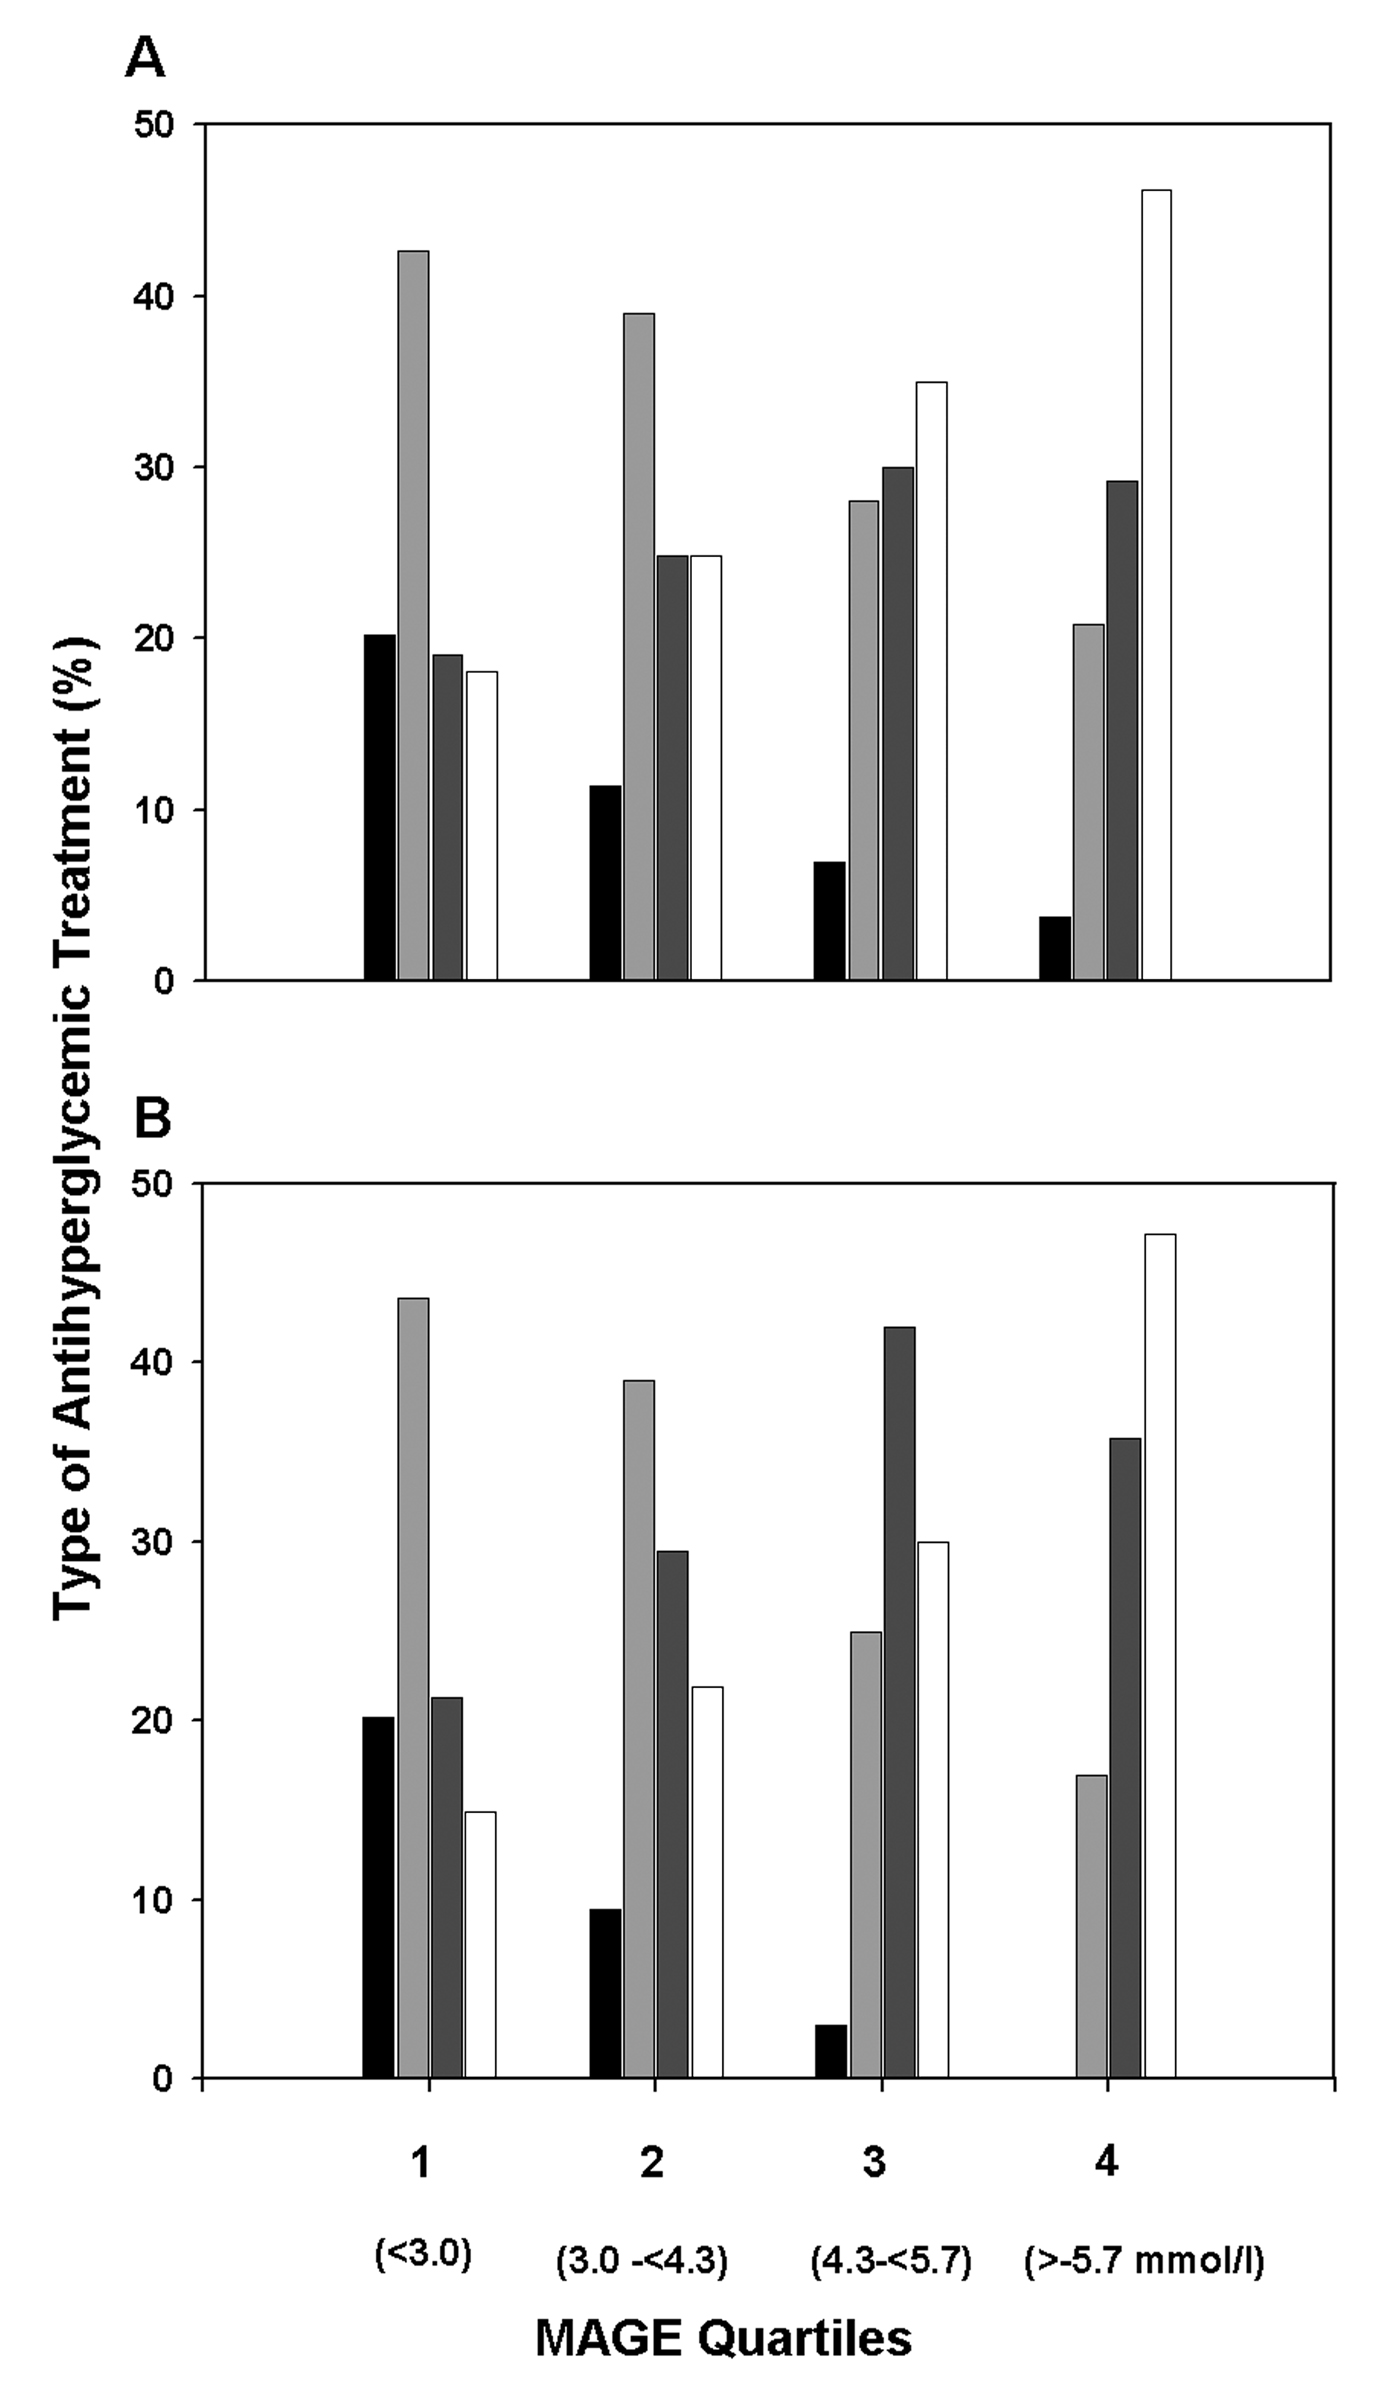
Journal of Endocrinology and Metabolism, ISSN 1923-2861 print, 1923-287X online, Open Access |
Article copyright, the authors; Journal compilation copyright, J Endocrinol Metab and Elmer Press Inc |
Journal website http://www.jofem.org |
Original Article
Volume 1, Number 2, June 2011, pages 64-72
Reduced Glucose Variability Is Associated With Improved Quality of Glycemic Control in Patients With Type 2 Diabetes: A 12-Month Observational Study
Figures
Tables
Parameter | Quartiles of MAGE | |||
---|---|---|---|---|
1st (n = 94) | 2nd (n = 105) | 3rd (n = 100) | 4th (n = 106) | |
Data are presented as means ± SD or medians (25th - 75th percentile).Hyperglycemia: > 8.9 mmol/l; target range: 3.9 - 8.9 mmol/l; hypoglycemia: < 3.9 mmol/l. | ||||
Glucose variability | ||||
MAGE (mmol/l) | 2.4 ± 0.5 | 3.7 ± 0.4 | 5.0 ± 0.4 | 7.7 ± 1.9 |
SD (mmol/l) | 0.9 ± 0.1 | 1.4 ± 0.2 | 1.9 ± 0.3 | 2.8 ± 0.7 |
MODD (mmol/l) | 1.0 ± 0.3 | 1.5 ± 0.4 | 1.9 ± 0.6 | 2.7 ± 0.9 |
Glycemic control | ||||
A1C (%) | 6.6 ± 0.7 | 6.9 ± 0.9 | 7.1 ± 0.9 | 7.5 ± 1.1 |
(mmol/L) | 49.1 ± 8.1 | 51.4 ± 9.8 | 54.3 ± 10.2 | 58.4 ± 11.9 |
Fasting glucose (mmol/l) | 6.6 ± 1.1 | 6.8 ± 1.8 | 7.0 ± 1.7 | 7.2 ± 2.3 |
Mean glucose (mmol/l) | 6.9 ± 1.0 | 7.4 ± 1.7 | 8.0 ± 1.7 | 8.7 ± 1.8 |
Hyperglycemia (h/day) | 0.9 (0.1 - 2.4) | 3.3 (1.4 - 6.3) | 6.3 (3.8 - 9.7) | 8.7 (5.4 - 14.1) |
Target range (h/day) | 22.9 (21.2 - 23.5) | 19.8 (17.2 - 21.7) | 17.3 (14.3 - 19.6) | 13.2 (9.7 - 16.8) |
Hypoglycemia (min/day) | 0.0 (0.0 - 11.4) | 2.4 (0.0 - 36.0) | 5.7 (9.9 - 51.6) | 39.3 (0.0 - 140.3) |
GRADE score | 2.9 (2.3 - 4.4) | 4.2 (3.0 - 6.3) | 5.9 (4.6 - 7.6) | 8.1 (6.1 - 11.1) |
HBGI | 0.4 (0.2 - 0.9) | 1.0 (0.5 - 1.8) | 1.8 (1.1 - 2.8) | 3.1 (1.9 - 5.5) |
LBGI | 0.1 (0.0 - 0.3) | 0.2 (0.0 - 0.6) | 0.2 (0.0 - 0.7) | 0.5 (0.1 - 1.4) |
Parameter | Quartiles of MAGE | |||
---|---|---|---|---|
1st (n = 94) | 2nd (n = 105) | 3rd (n = 100) | 4th (n = 106) | |
Change | Change | Change | Change | |
Data are presented as means ± SD or medians (25th - 75th percentile) of differences (Δ) from baseline. Negative values correspond to a reduction in parameters. P values for paired t test or Wilcoxon signed-rank test within individual patients are shown: *P < 0.05; †P < 0.01; ‡P < 0.001. Hyperglycemia: > 8.9 mmol/l; target range: 3.9 - 8.9 mmol/l; hypoglycemia: < 3.9 mmol/l. Significance level P < 0.05. | ||||
Glucose variability | ||||
ΔMAGE (mmol/l) | 0.75 ± 1.37‡ | 0.31 ± 1.45* | -0.21 ± 1.77 | -1.78 ± 2.29‡ |
ΔSD (mmol/l) | 0.25 ± 0.48‡ | 0.10 ± 0.54 | -0.05 ± 0.59 | -0.61 ± 0.83‡ |
ΔMODD (mmol/l) | 0.23 ± 0.54‡ | 0.13 ± 0.70 | -0.02 ± 0.76 | -0.42 ± 1.10‡ |
Glycemic control | ||||
ΔA1C (%) | -0.15 ± 0.57* | -0.02 ± 0.86 | -0.10 ± 0.86 | -0.32 ± 0.82‡ |
(mmol/L) | -1.65 ± 6.27 | -0.25 ± 9.35 | -1.14 ± 9.35 | -3.49 ± 9.00 |
ΔFasting glucose (mmol/l) | 0.14 ± 1.18 | -0.05 ± 1.81 | 0.02 ± 1.81 | -0.30 ± 2.50 |
ΔMean glucose (mmol/l) | 0.14 ± 1.00 | -0.02 ± 1.54 | -0.17 ± 1.79 | -0.58 ± 1.81† |
ΔHyperglycemia (h/day) | 0.4 (-0.7 - 2.3)* | -0.2 (-2.0 - 1.4) | -0.6 (-3.0 - 2.5) | -1.4 (-4.2 - 1.3)† |
ΔTarget range (h/day) | -0.5 (-2.5 - 0.7)* | 0.6 (-1.7 - 2.7) | 0.2 (-2.5 - 3.2) | 2.2 (-0.2 - 5.5)‡ |
ΔHypoglycemia (min/day) | 0.0 (-7.1 - 5.3) | 0.0 (-30.3 - 25.8) | 0.0 (-26.1 - 15.0) | -5.1 (-94.4 - 21.9)† |
ΔGRADE score | 0.54 ± 2.18* | -0.11 ± 3.44 | -0.47 ± 3.99 | -1.80 ± 3.73‡ |
ΔHBGI | 0.1 (-0.1 - 0.7)† | -0.0 (-0.6 - 0.7) | -0.2 (-0.9 - 0.8) | -0.8 (-2.4 - 0.3)‡ |
ΔLBGI | 0.0 (-0.2 - 0.2) | 0.0 (-0.3 - 0.2) | -0.0 (-0.2 - 0.3) | -0.1 (-0.8 - 0.2)* |
MAGEBL | ΔMAGEBL-EP | GRADEBL | ΔGRADEBL-EP | A1CBL | |
---|---|---|---|---|---|
Data represent Pearson correlation coefficients. The area above the diagonal is not shown because the table is symmetrical. *P < 0.05 (two-sided); ‡P < 0.001 (two-sided). GRADE: Glycemic Risk Association Diabetes Equation; BL: baseline; EP: endpoint. ΔBL-EP: difference between baseline and endpoint of the 12-month observation period. | |||||
ΔMAGEBL-EP | -0.540‡ | ||||
GRADEBL | 0.530‡ | -0.167‡ | |||
ΔGRADEBL-EP | -0.256‡ | 0.371‡ | -0.619‡ | ||
A1CBL | 0.328‡ | -0.076 | 0.531‡ | -0.203‡ | |
ΔA1CBL-EP | -0.081 | 0.103* | -0.247‡ | 0.321‡ | -0.579‡ |
Dependent variable | Explanatory variable | Regression coefficient (ß) | SE | Pvalue | Coefficient of determination (R2) |
---|---|---|---|---|---|
Significance level P < 0.05. | |||||
Time spent at < 3.9 mmol/l | Mean glucose | -0.558 | 2.057 | < 0.001 | 0.121 |
MAGE | 0.544 | 1.604 | < 0.001 | 0.374 | |
Time spent at > 8.9 mmol/l | Mean glucose | 0.868 | 0.061 | < 0.001 | 0.857 |
MAGE | 0.154 | 0.048 | < 0.001 | 0.877 |