Figures
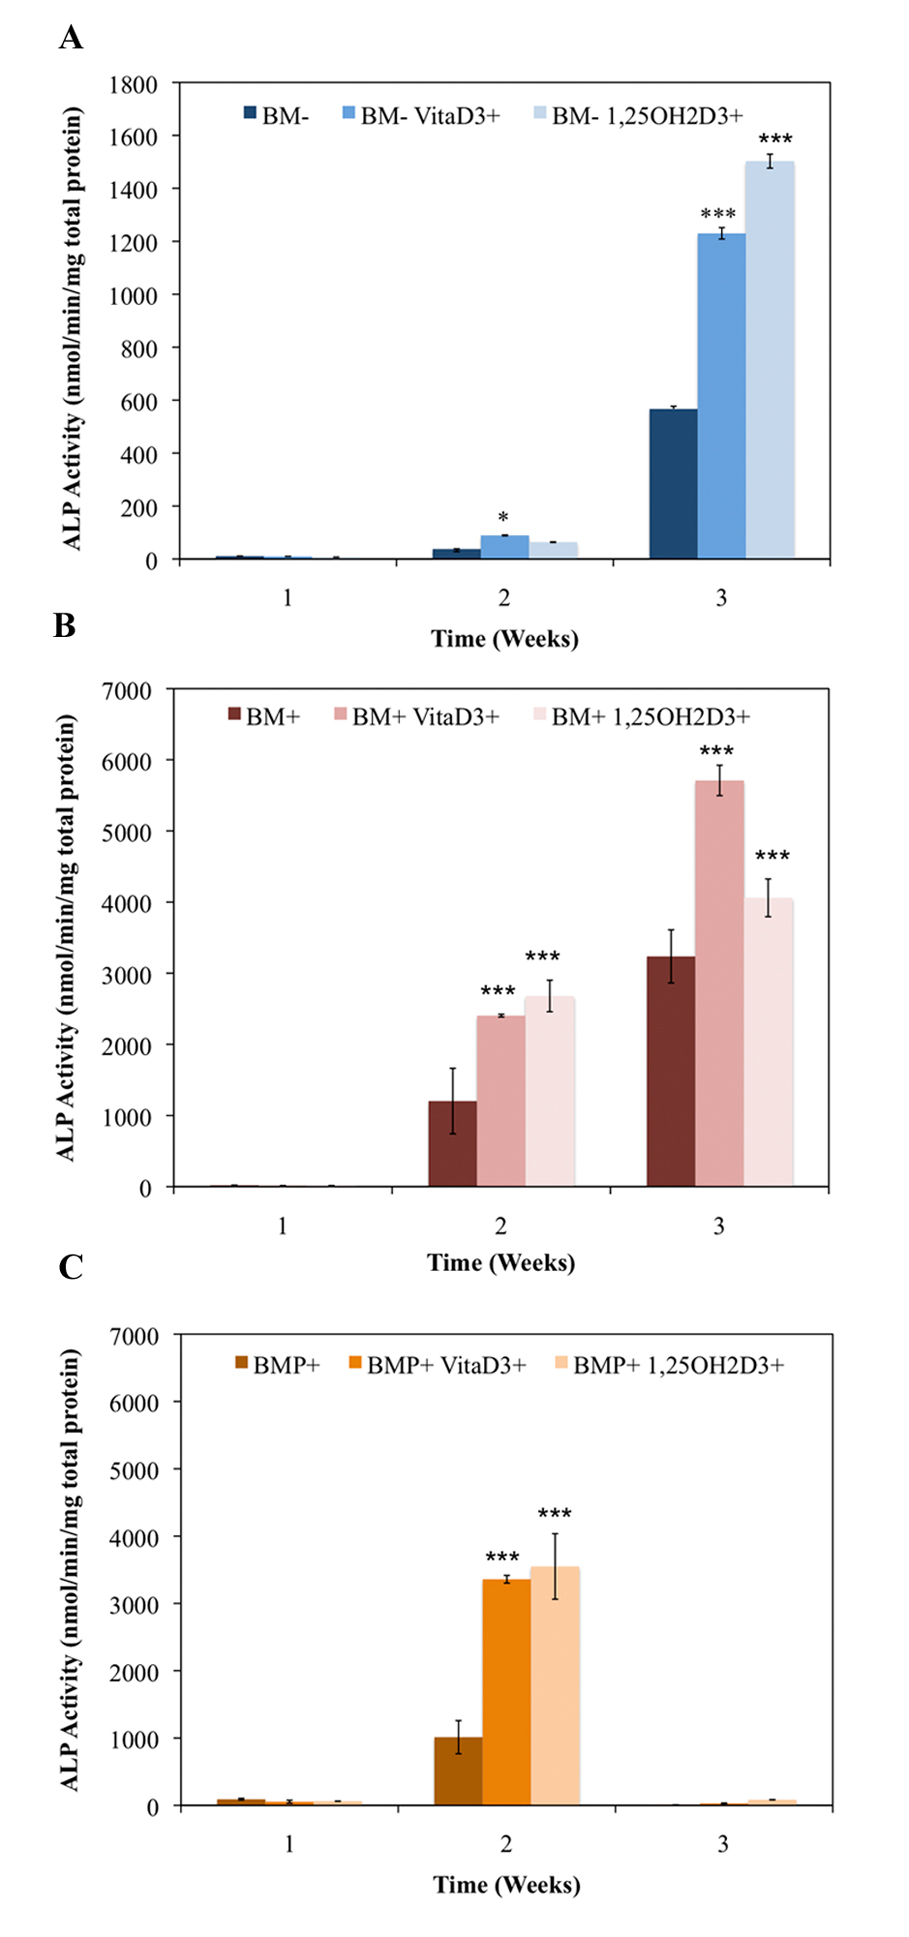
Figure 1. Temporal alkaline phosphatase activity of OPC1 treated with (A) ethanol vehicle control in standard bone medium (BM-), BM- containing vitamin D3 (BM- vitaD3+) and BM- with 1,25OH2D3(BM- 1,25OH2D3+); (B) ethanol control in osteogenic medium (BM+) containing ascorbic acid,β-glycerophosphate and dexamethasone, BM+ containing vitamin D3 (BM+ vitaD3+), and BM+ with 1,25OH2D3 (BM+ vitaD3+); (C) ethanol control in BM+ containing rhBMP (BMP+), BMP+ containing vitamin D3 (BMP+ vitaD3+), and BMP+ with 1,25OH2D3 (BMP+ vitaD3+). Cellular isolates were collected on day 7, 14 and 21 during the differentiation time course. Treatment with both vitamin D metabolites significantly influenced OPC1 ALP activity in all medium groups (P < 0.01).
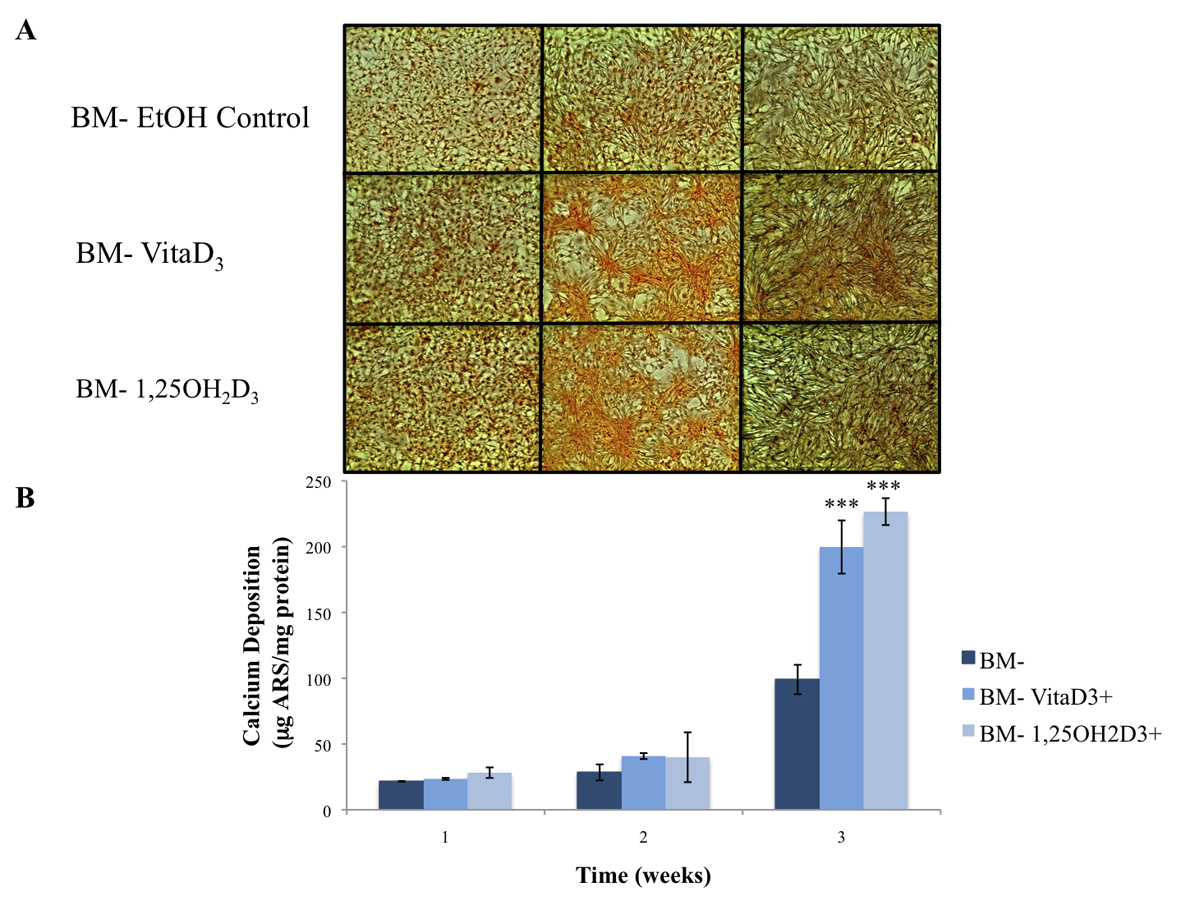
Figure 2. (A) Calcium deposition stained with alizarin red stain (ARS) of OPC1 cultured in BM- and either vitamin D metabolites, vitamin D3 or 1,25OH2D3. (B) After microscopic analysis, ARS was extracted from each culture well, and quantified on a microplate reader. By week three of culture, there was a statistically larger amount of calcium deposition detected by ARS in cells treated with either vitamin D3 or 1,25OH2D3 compared to that of the ethanol control (***P < 0.001).
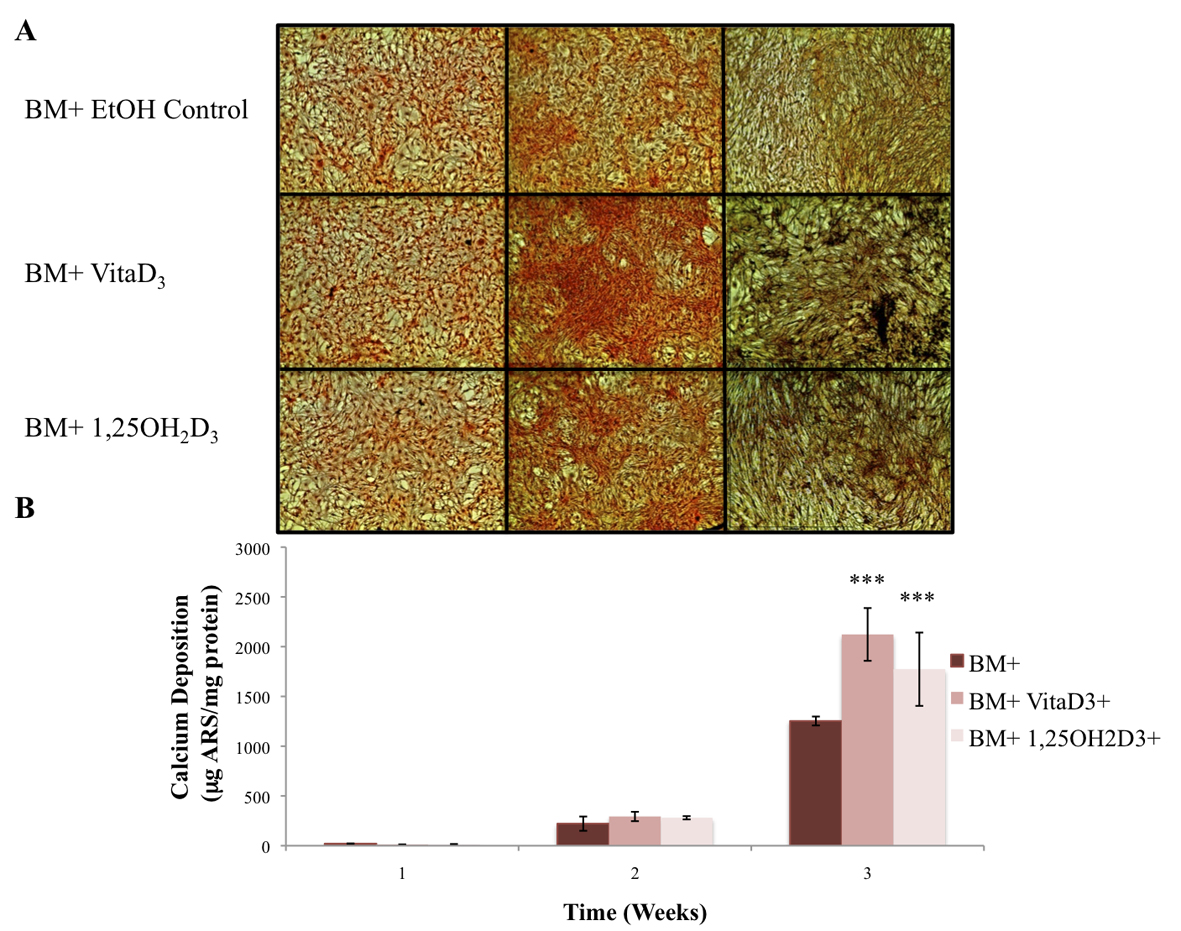
Figure 3. (A) OPC1 calcium deposition stained with ARS during culture in BM+ and either vitamin D3 or 1,25OH2D3. (B) After microscopic analysis, ARS was extracted from each culture well and read on a microplate reader. By week three of culture, there again was a larger amount of calcium deposition detected by ARS in cells treated with either vitamin D3 or 1,25OH2D3 compared to that of the ethanol control (***P <0.001). In addition, there was more calcium deposition in the BM+ treatment groups compared to all BM- groups (shown in Fig. 2).
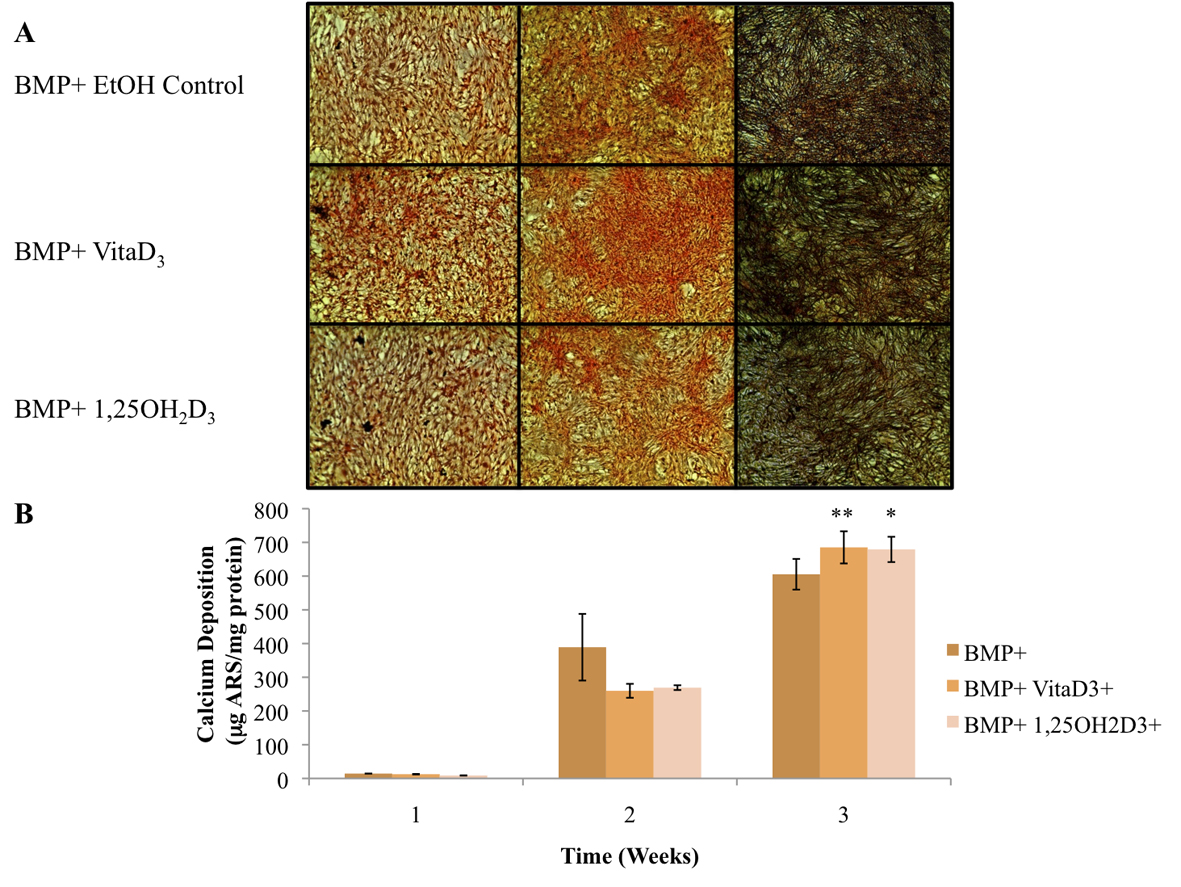
Figure 4. (A) OPC1 calcium deposition as stained with ARS during culture in BMP+ containing rhBMP-2 (BMP+) and either vitamin D3 or 1,25OH2D3. (B) Quantified ARS as extracted from each culture well and read on a microplate reader. In the second week of culture, the BMP+ EtOH control had a larger amount of calcium deposition in comparison with the treatment groups (P < 0.05). By week three of culture, there was more calcium deposition detected by ARS in cells treated with either vitamin D metabolites compared to that of the ethanol control (*P< 0.01). In addition, there was a statistically more calcium deposition in the BMP+ treatment groups (P < 0.001) compared to all BM- groups (plotted in Fig. 2).
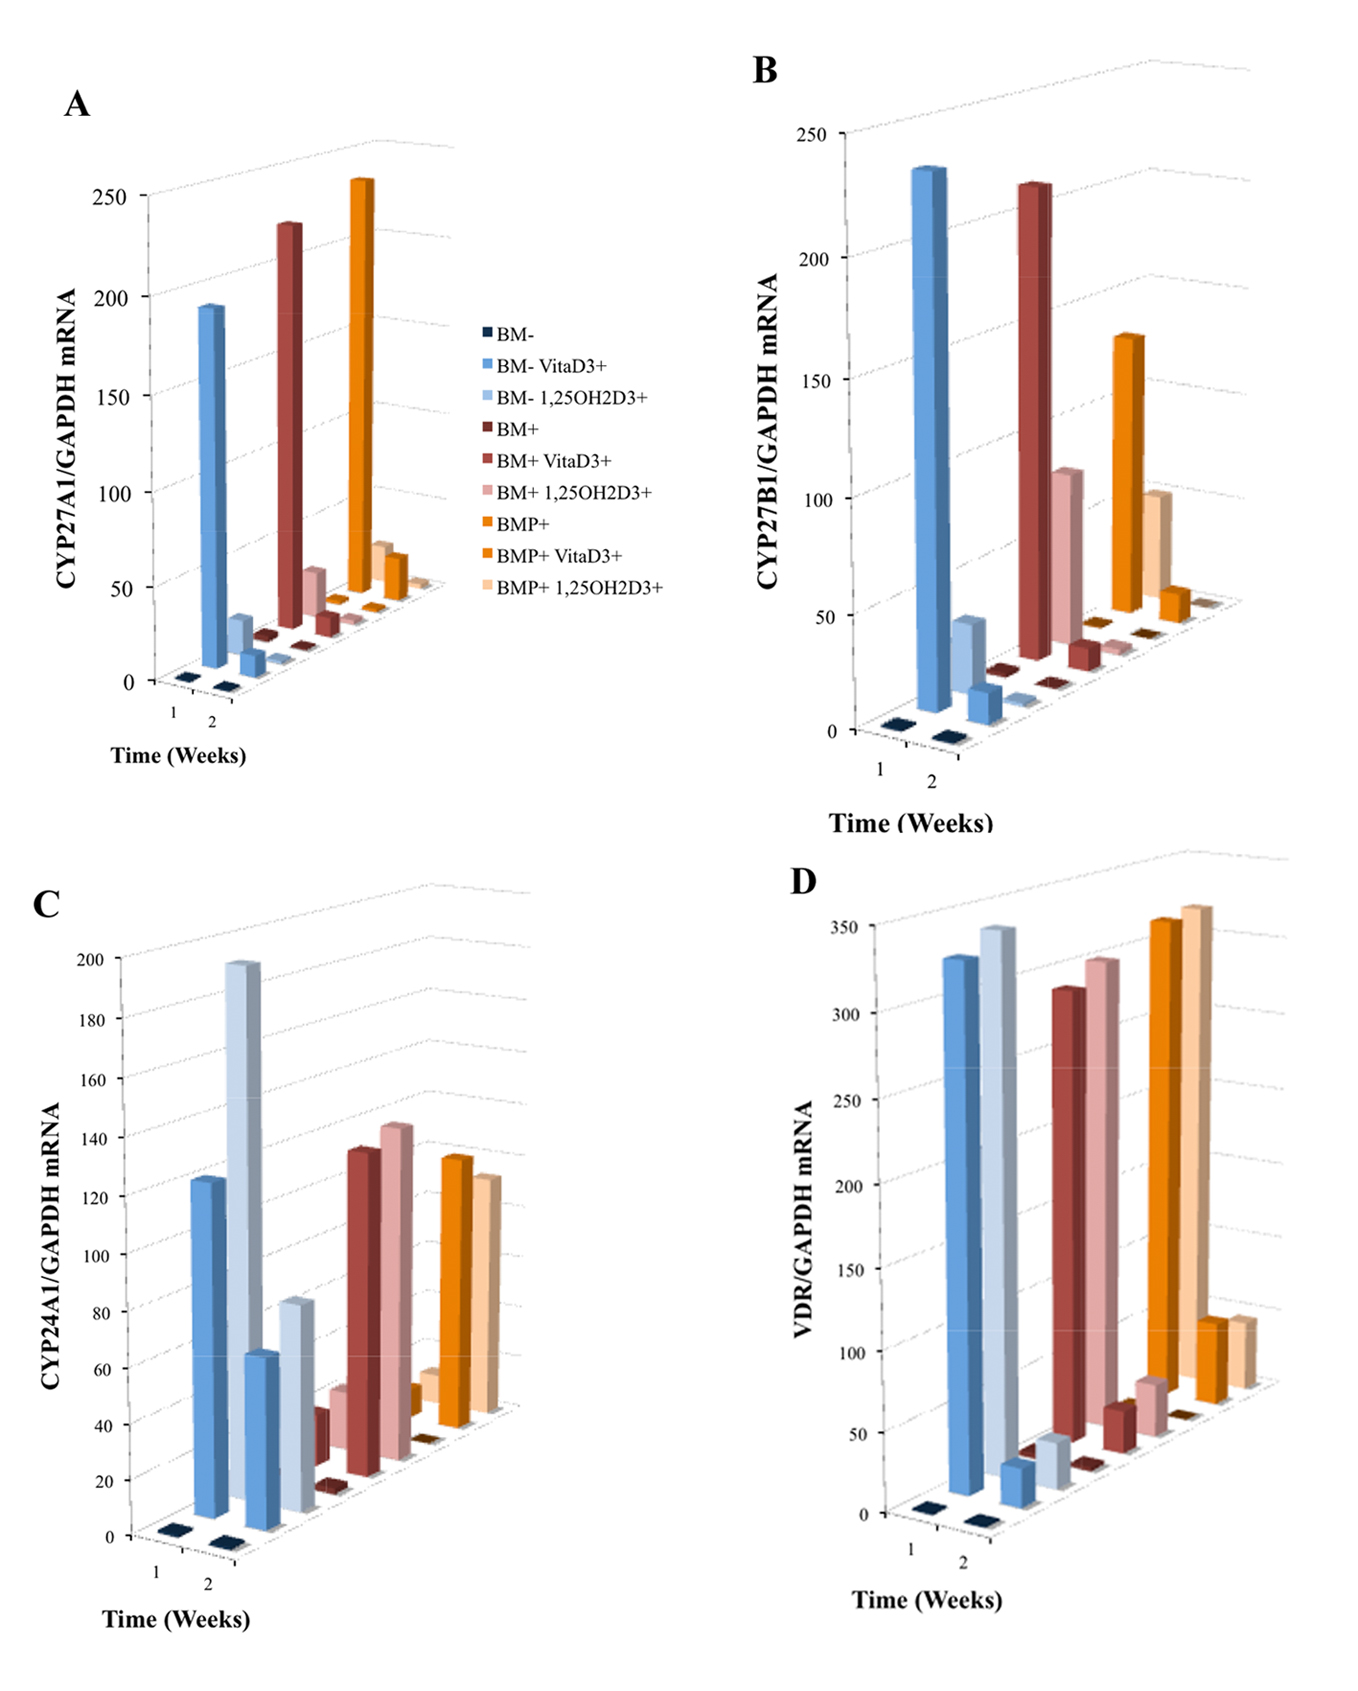
Figure 5. Induced mRNA expression of (A) CYP27A1, (B) CYP27B1, (C) CYP24A1 and (D) VDR in nine treatment group cultures of OPC1s including either vitamin D3 or 1,25OH2D3 in standard bone medium (BM-) and medium containing osteogenic factors (BM+ and BMP+). Total RNA was isolated and examined by quantitative RT-PCR. Data were normalized by the level of glyceraldehyde 3-phosphate dehydrogenase (GAPDH), a protein-coding gene. The figure legend for (A) applies to Fig. 5 and 6 where the bars (front to back) are associated with the listed experimental groups (top to bottom).
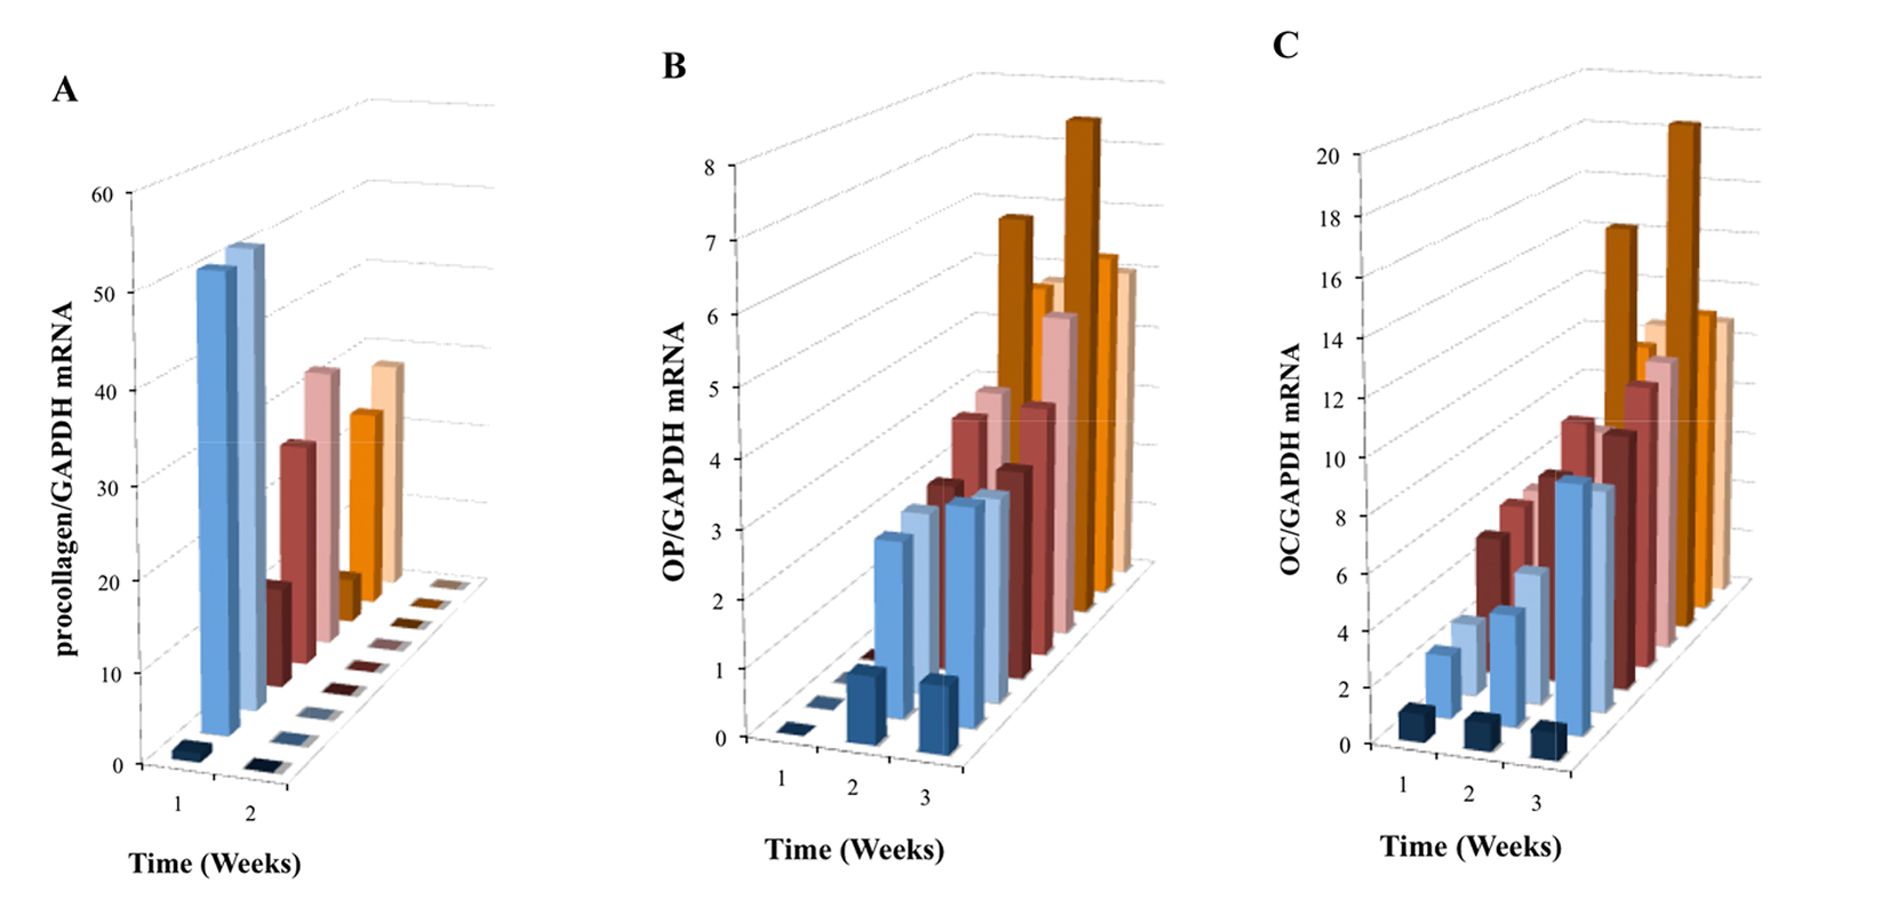
Figure 6. Induced mRNA expression of (A) proColI, (B) OP and (C) OC in nine treatment group OPC1 cultures containing the vitamin D metabolites and/or osteogenic factors (see the figure legend for Fig. 5A). Total RNA was isolated and examined by quantitative RT-PCR and data were again normalized by levels of GAPDH.
Table
Table 1. Oligionucleotide Single-Stranded Molecular Primers Used in Quantitative, Real-Time RT-PCR
| Primer set | Forward | Reverse |
|---|
| CYP24A1 | 5’ - GCA GCC TAG TGC AGA TTT - 3’ | 5’ - ATT CAC CCA GAA CTG TTG - 3’ |
| CYP27A1 | 5’ - GGC AAG TAC CCA GTA CGG - 3’ | 5’ - AGC AAA TAG CTT CCA AGG - 3’ |
| CYP27B1 | 5’ - TGT TTG CAT TTG CTC AGA - 3’ | 5’ - CCG GGA GAG CTC ATA CAG - 3’ |
| VDR | 5’ - CCA GTT CGT GTG AAT GAT GG - 3’ | 5’ - GTC GTC GGT GAA GGA - 3’ |
| OC/BGLAP | 5’ - CTG GCC ACT GCA TTC TGC - 3’ | 5’ - AAC GGT GGT GCC ATA GAT GCG - 3’ |
| OP/SPP1 | 5’ - AAA TAC CCA GAT GTG GC - 3’ | 5’ - AAC CAC ACT ACC TCG GC - 3’ |
| Pro-ColI | 5’ - TGA CGA GAC CAA GAA CTG - 3’ | 5’ - CCA AAG TCA CCA AAC CTA CC - 3’ |