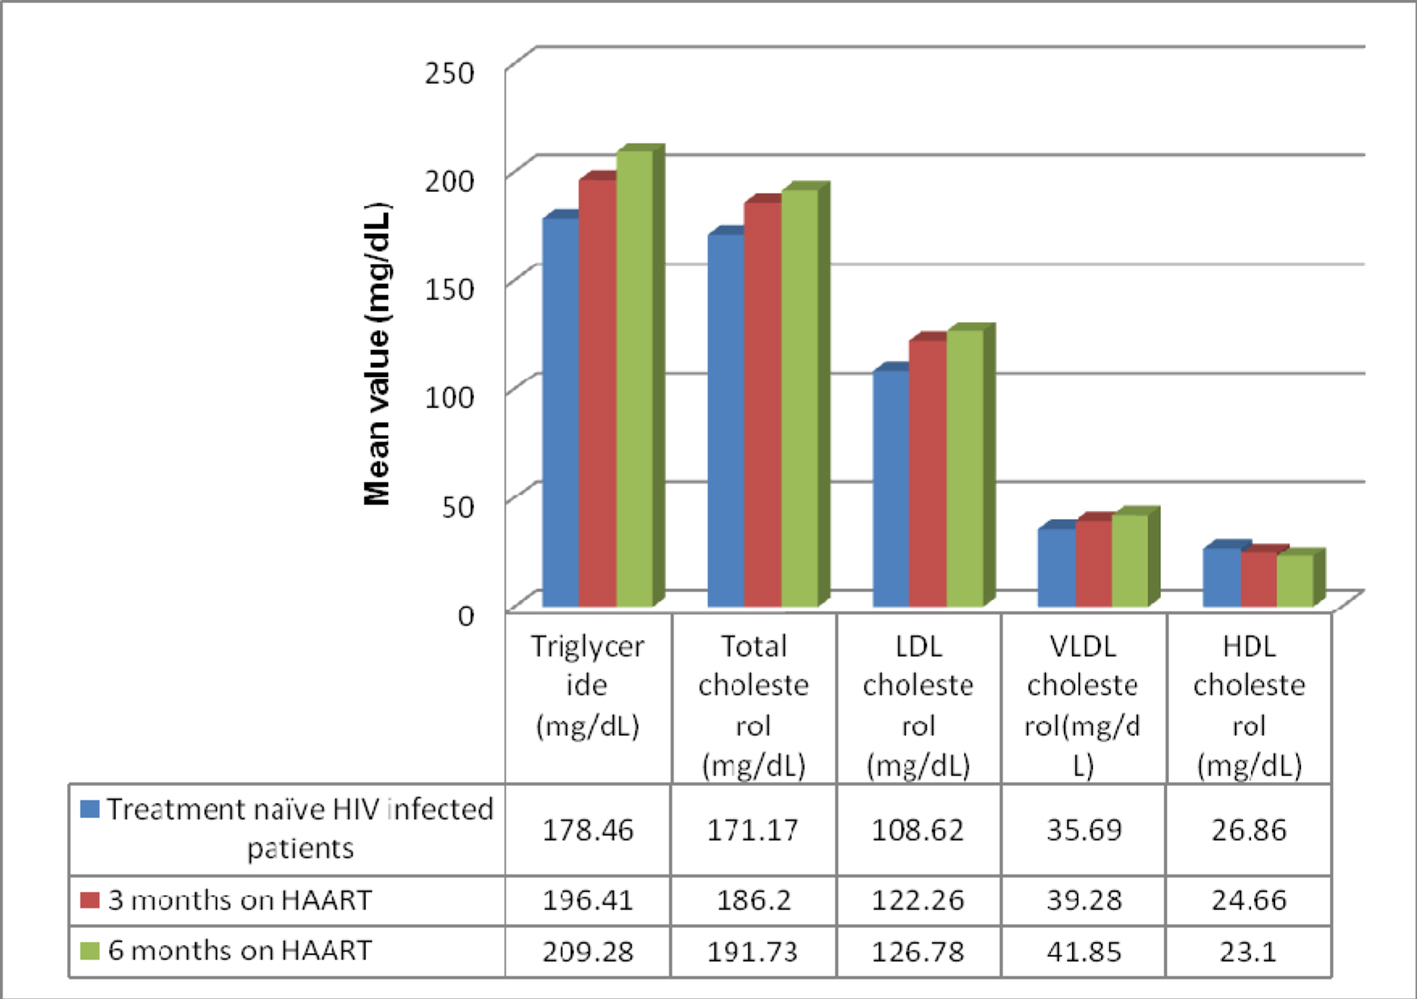
Figure 1. Mean value of lipid profile in treatment-naive HIV-infected patients and after 3 and 6 months of follow-up.
| Journal of Endocrinology and Metabolism, ISSN 1923-2861 print, 1923-287X online, Open Access |
| Article copyright, the authors; Journal compilation copyright, J Endocrinol Metab and Elmer Press Inc |
| Journal website http://www.jofem.org |
Original Article
Volume 4, Number 1-2, April 2014, pages 25-31
Alteration in Lipid Profile in Treatment-Naive HIV-Infected Patients and Changes Following HAART Initiation in Haryana
Figures
Tables
| Parameter | HIV-positive patients (n = 100) | HIV-negative controls (n = 100) | P value |
|---|---|---|---|
| *Significant; **Highly significant; all values are in mean ± SD. | |||
| Triglyceride (mg/dL) | 178.46 ± 58.41 | 136.26 ± 23.21 | < 0.001** |
| Total cholesterol (mg/dL) | 171.17 ± 52.24 | 175.09 ± 42.3 | 0.08 |
| LDL cholesterol (mg/dL) | 108.62 ± 38.67 | 98.62 ± 2.94 | < 0.05* |
| VLDL cholesterol (mg/dL) | 35.69 ± 11.76 | 27.25 ± 4.6 | < 0.05* |
| HDL cholesterol (mg/dL) | 26.86 ± 12.69 | 49.22 ± 34.76 | < 0.001** |
| Parameter | Treatment-naive HIV-positive patients | 3 months on HAART | P value | 6 months on HAART | P value |
|---|---|---|---|---|---|
| *Significant; **Highly significant; all values are in mean ± SD. | |||||
| Number of patients | 100 | 100 | - | 100 | - |
| Weight (kg) | 51.41 ± 9.95 | 54.14 ± 10.23 | < 0.001** | 54.78 ± 9.75 | < 0.001** |
| BMI (kg/m2) | 23.27 ± 4.21 | 24.21 ± 3.25 | < 0.001** | 25.61 ± 3.89 | < 0.001** |
| Waist circumference (cm) | 70.57 ± 7.88 | 72.29 ± 8.15 | < 0.001** | 72.97 ± 8.16 | < 0.001** |
| Hip circumference (cm) | 81.03 ± 7.34 | 81.95 ± 7.56 | < 0.001** | 82.04 ± 7.42 | < 0.001** |
| Waist/hip ratio | 0.87 ± 0.06 | 0.88 ± 0.06 | < 0.001** | 0.89 ± 0.06 | < 0.001** |
| CD4 count (/mL) | 150.86 ± 67.32 | 210.45 ± 35.62 | < 0.001** | 361 ± 194.01 | < 0.001** |
| Triglyceride (mg/dL) | 178.46 ± 58.41 | 196.41 ± 64.44 | < 0.001** | 209.28 ± 71.34 | < 0.001** |
| Total cholesterol (mg/dL) | 171.17 ± 52.24 | 186.20 ± 53.37 | < 0.001** | 191.73 ± 53.68 | < 0.001** |
| LDL cholesterol (mg/dL) | 108.62 ± 38.67 | 122.26 ± 38.29 | < 0.001** | 126.78 ± 39.74 | < 0.001** |
| VLDL cholesterol (mg/dL) | 35.69 ± 11.76 | 39.28 ± 12.93 | < 0.001** | 41.85 ± 14.43 | < 0.001** |
| HDL cholesterol (mg/dL) | 26.86 ± 12.69 | 24.66 ± 11.58 | < 0.001** | 23.10 ± 11.44 | < 0.001** |
| Parameter | Treatment-naive patients | After 6 months of HAART | P value |
|---|---|---|---|
| *Significant; **Highly significant. | |||
| TC (> 230 mg/dL) | 8% | 12% | < 0.001** |
| TG (> 160 mg/dL) | 29% | 52% | < 0.001** |
| LDL-C (> 160 mg/dL) | 7% | 9% | < 0.001** |
| VLDL-C (> 32 mg/dL) | 23% | 48% | < 0.001** |
| HDL-C (< 30 mg/dL) | 10% | 33% | < 0.001** |