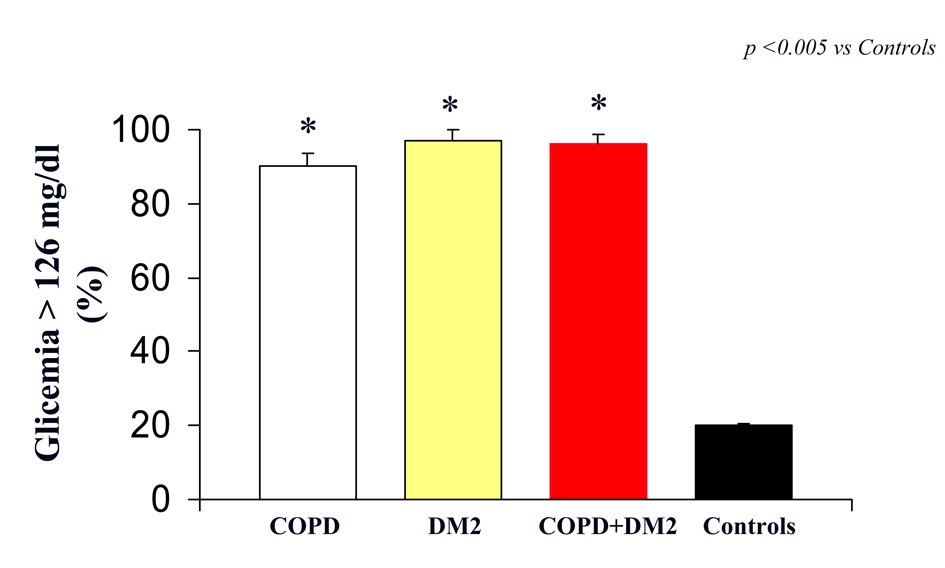
Figure 1. Glicemia (indicated as % of patients with value > 126 mg/dL) in COPD (white column), DM2 (yellow column), COPD+DM2 (red column), and control (black column). Values are mean ±SEM. * P < 0.005 vs C.
| Journal of Endocrinology and Metabolism, ISSN 1923-2861 print, 1923-287X online, Open Access |
| Article copyright, the authors; Journal compilation copyright, J Endocrinol Metab and Elmer Press Inc |
| Journal website http://www.jofem.org |
Original Article
Volume 3, Number 4-5, October 2013, pages 91-97
Unbalance Glycometabolic in Elderly Woman None Diabetic COPD Patients
Figures
Table
| COPD | DM2 | COPD+DM2 | CONTROLS | P value | |
|---|---|---|---|---|---|
| BMI: body mass index; COPD: chronic obstructive pulmonary disease; DM2: type 2 diabetes. Values are expressed by mean ± SE. | |||||
| Number (m) | 75 (35) | 75 (40) | 75 (45) | 75 (40) | ns |
| Age (yr) | 76.2 ± 1 | 74.3 ± 2 | 74.7 ± 2 | 75.6 ± 3 | ns |
| BMI (kg/m2) | 25.5 ± 3 | 26.1 ± 2 | 26.3 ± 1 | 25.4 ± 2 | ns |
| HbA1c (%) | 8.1 ± 0.6* | 8.2 ± 1.1* | 8.0 ± 1.0* | 4.1 ± 0.4 | < 0.005 |
| Smoking (n) | 65 | 50 | 45 | 55 | ns |
| Wood Smoke (n) | 10 | 25 | 30 | 20 | ns |
| Glucose pre-prandial (mg/dL) | 145 ± 7* | 150 ± 5* | 156 ± 3* | 106 ± 2* | < 0.0001 |
| Corticosteroids therapy (n.) | 75 | - | 75 | - | ns |
| Hypoglicaemic therapy (n.) | - | 75 | 75 | - | ns |
| Dietotherapy (n.) | 75 | 75 | 75 | 75 | ns |
| Physical exercise (n.) | 75 | 75 | 75 | 75 | ns |
| FEV1 (%) | 55* | 85 | 50* | 90 | < 0.0001 |