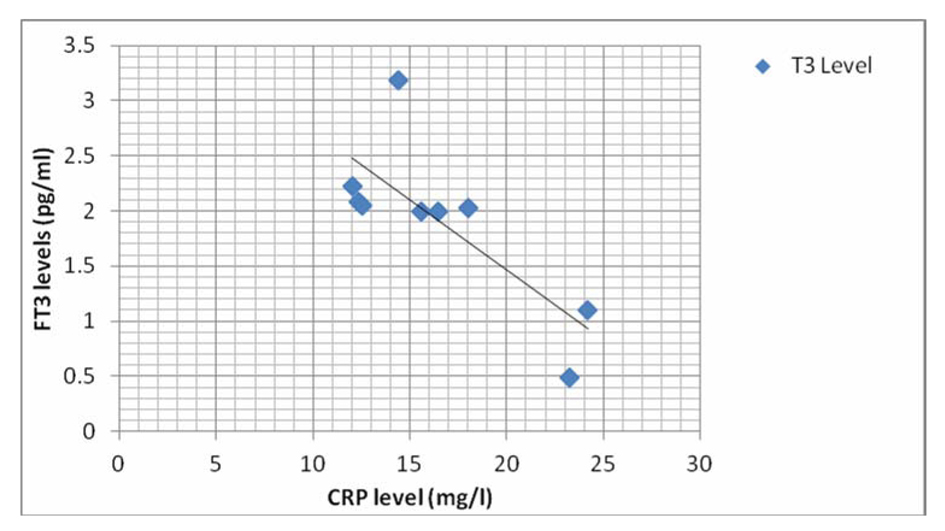
Figure 1. Graph showing correlation of CRP with FT3 level in septic shock survivor group.
| Journal of Endocrinology and Metabolism, ISSN 1923-2861 print, 1923-287X online, Open Access |
| Article copyright, the authors; Journal compilation copyright, J Endocrinol Metab and Elmer Press Inc |
| Journal website http://www.jofem.org |
Original Article
Volume 3, Number 3, June 2013, pages 62-66
Thyroid Hormone Dysfunction and CRP Levels in Neonates With Sepsis
Figures
Tables
| Groups | N | CRP (mg/L) | FT3 (pg/mL) | FT4 (ng/dL) | TSH (µIU/mL) |
|---|---|---|---|---|---|
| Control group | 40 | 1.033 ± 0.82 | 3.99 ± 1.98 | 2.45 ± 2.21 | 4.72 ± 3.14 |
| Septic neonates | 40 | 20.24 ± 25.09 | 1.98 ± 0.73 | 1.51 ± 0.89 | 4.64 ± 4.40 |
| P-value | P < 0.0001 | P < 0.0001 | P < 0.001 | P > 0.05 |
| Groups | N | CRP (mg/L) | FT3 (pg/mL) | FT4 (ng/dL) | TSH (µIU/mL) |
|---|---|---|---|---|---|
| a: significantly different compared to septic survivors, P < 0.05; b: significantly different compared to septic-shock survivors P < 0.05; c: No significant difference with sepsis survivors; d: No significant difference with septic-shock survivors. | |||||
| Sepsis Survivor Group | 19 | 4.92 ± 1.48 | 2.12 ± 0.66 | 2.33 ± 0.78 | 3.80 ± 3.64 |
| Septic-Shock Survivor Group | 9 | 16.53 ± 4.54a | 1.90 ± 0.75c | 1.95 ± 1.41c | 5.68 ± 4.62c |
| Non-Survivor Group | 12 | 49.33 ± 29.91a, b | 1.52 ± 0.86a, d | 1.47 ± 0.90a, d | 5.02 ± 2.45c, d |