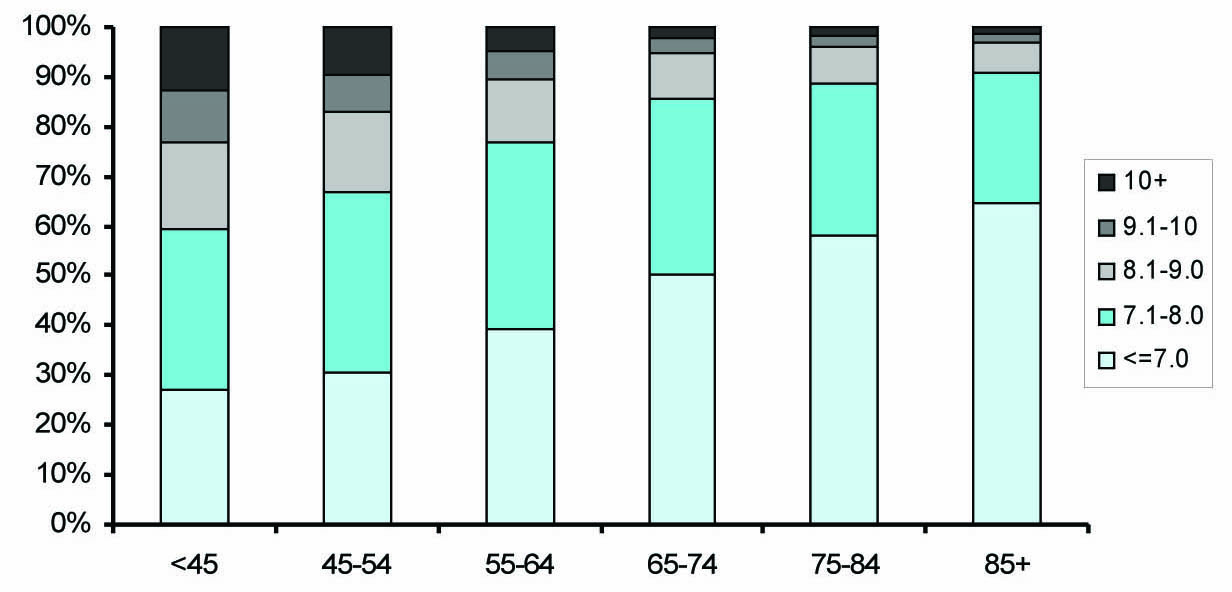
Figure 1. Distribution of mean HbA1c (%) by age group.
| Journal of Endocrinology and Metabolism, ISSN 1923-2861 print, 1923-287X online, Open Access |
| Article copyright, the authors; Journal compilation copyright, J Endocrinol Metab and Elmer Press Inc |
| Journal website http://www.jofem.org |
Original Article
Volume 1, Number 1, April 2011, pages 27-37
Association of Younger Age With Poor Glycemic and Cholesterol Control in Asians With Type 2 Diabetes Mellitus in Singapore
Figures
Tables
| Characteristic | Age Group | |||||||||||||
|---|---|---|---|---|---|---|---|---|---|---|---|---|---|---|
| < 45 | 45 - 54 | 55 - 64 | 65 - 74 | 75 - 84 | 85+ | All | ||||||||
| N = 2537 | N = 9712 | N = 18200 | N = 16390 | N = 9245 | N = 1973 | N = 58057 | ||||||||
| n | % | n | % | n | % | n | % | n | % | n | % | n | % | |
| Gender | ||||||||||||||
| Female | 1201 | 47 | 4780 | 49 | 9226 | 51 | 9047 | 55 | 5639 | 61 | 1330 | 67 | 31223 | 54 |
| Male | 1336 | 53 | 4932 | 51 | 8974 | 49 | 7343 | 45 | 3606 | 39 | 643 | 33 | 26834 | 46 |
| Race | ||||||||||||||
| Chinese | 1360 | 54 | 5586 | 58 | 12670 | 70 | 12543 | 77 | 7343 | 79 | 1702 | 86 | 41204 | 71 |
| Indian | 574 | 23 | 1823 | 19 | 2471 | 14 | 1655 | 10 | 847 | 9 | 115 | 6 | 7485 | 13 |
| Malay | 475 | 19 | 1880 | 19 | 2488 | 14 | 1726 | 11 | 790 | 9 | 100 | 5 | 7459 | 13 |
| Others | 128 | 5 | 423 | 4 | 571 | 3 | 466 | 3 | 265 | 3 | 56 | 3 | 1909 | 3 |
| Other medical problems | ||||||||||||||
| Hypertension | 1344 | 53 | 6707 | 69 | 14992 | 82 | 14836 | 91 | 8732 | 94 | 1872 | 95 | 48483 | 84 |
| Dyslipidaemia | 2409 | 95 | 9484 | 98 | 17878 | 98 | 16152 | 99 | 9102 | 98 | 1902 | 96 | 56927 | 98 |
| Coronary Heart Disease | 123 | 5 | 1008 | 10 | 2975 | 16 | 3998 | 24 | 3147 | 34 | 799 | 40 | 12050 | 21 |
| Stroke | 48 | 2 | 462 | 5 | 1423 | 8 | 2131 | 13 | 1785 | 19 | 512 | 26 | 6361 | 11 |
| Maculopathy/Retinopathy | 149 | 6 | 869 | 9 | 1820 | 10 | 1579 | 10 | 874 | 9 | 152 | 8 | 5443 | 9 |
| Peripheral Vascular Disease | 41 | 2 | 253 | 3 | 579 | 3 | 709 | 4 | 584 | 6 | 155 | 8 | 2321 | 4 |
| Body Mass Index (BMI) | ||||||||||||||
| Underweight | 20 | 1 | 59 | 1 | 184 | 1 | 299 | 2 | 266 | 3 | 80 | 4 | 908 | 2 |
| Normal | 416 | 16 | 2154 | 22 | 5265 | 29 | 5738 | 35 | 3245 | 35 | 592 | 30 | 17410 | 30 |
| Obese I | 453 | 18 | 1537 | 16 | 2130 | 12 | 1343 | 8 | 534 | 6 | 58 | 3 | 6055 | 10 |
| Obese II | 275 | 11 | 661 | 7 | 702 | 4 | 327 | 2 | 137 | 1 | 17 | 1 | 2119 | 4 |
| Overweight | 745 | 29 | 3155 | 32 | 6002 | 33 | 4658 | 28 | 2228 | 24 | 289 | 15 | 17077 | 29 |
| Missing | 628 | 25 | 2146 | 22 | 3917 | 22 | 4025 | 25 | 2835 | 31 | 937 | 47 | 14488 | 25 |
| Chronic Kidney Disease | ||||||||||||||
| Stage 1 | 1511 | 60 | 4574 | 47 | 5698 | 31 | 3046 | 19 | 919 | 10 | 116 | 6 | 15864 | 27 |
| Stage 2 | 499 | 20 | 3208 | 33 | 7697 | 42 | 7290 | 44 | 3499 | 38 | 566 | 29 | 22759 | 39 |
| Stage 3 | 60 | 2 | 523 | 5 | 2234 | 12 | 3814 | 23 | 3294 | 36 | 770 | 39 | 10695 | 18 |
| Stage 4 | 6 | 0 | 60 | 1 | 232 | 1 | 437 | 3 | 425 | 5 | 160 | 8 | 1320 | 2 |
| Stage 5 | 3 | 0 | 28 | 0 | 71 | 0 | 84 | 1 | 54 | 1 | 22 | 1 | 262 | 0 |
| Missing | 458 | 18 | 1319 | 14 | 2268 | 12 | 1719 | 10 | 1054 | 11 | 339 | 17 | 7157 | 12 |
| Parameter | Unit | Age Group | |||||||||||||
|---|---|---|---|---|---|---|---|---|---|---|---|---|---|---|---|
| < 45 | 45 - 54 | 55 - 64 | 65 - 74 | 75 - 84 | 85+ | All | |||||||||
| Mean | SD | Mean | SD | Mean | SD | Mean | SD | Mean | SD | Mean | SD | Mean | SD | ||
| HbA1c: Glycated hemoglobin; LDL: Low-density lipoprotein; BP: Blood pressure. | |||||||||||||||
| HbA1c | % | 8.08 | 1.62 | 7.88 | 1.49 | 7.52 | 1.26 | 7.20 | 1.05 | 7.03 | 1.01 | 6.86 | 0.99 | 7.42 | 1.27 |
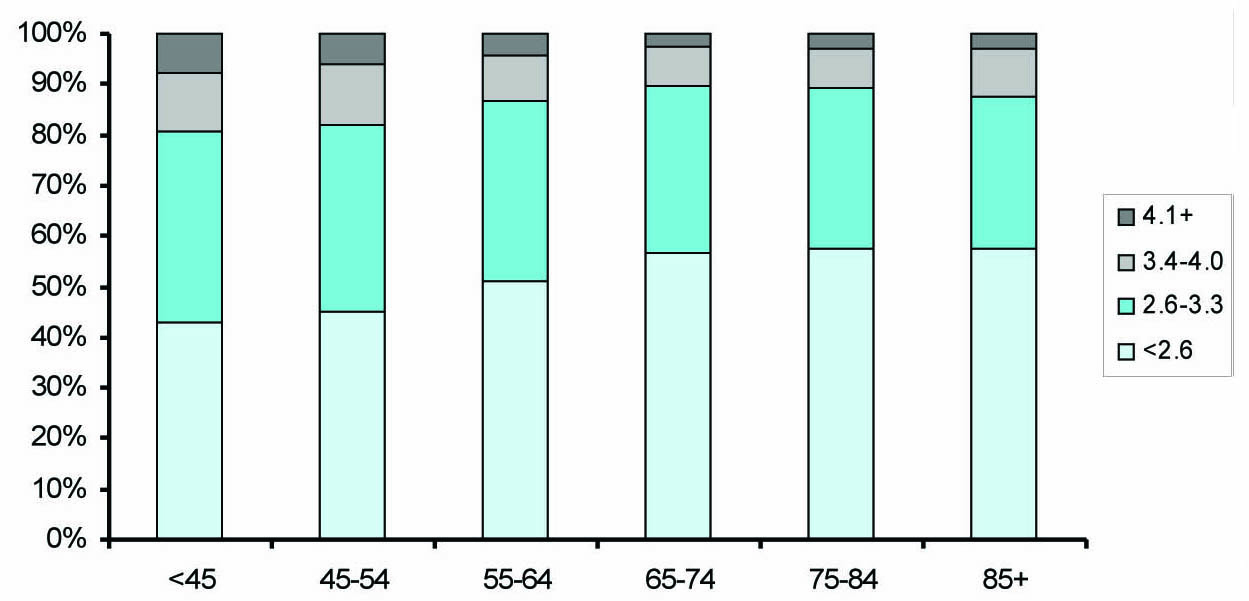
| LDL-cholesterol | mmol/L | 2.84 | 0.81 | 2.79 | 0.76 | 2.68 | 0.72 | 2.58 | 0.68 | 2.56 | 0.70 | 2.55 | 0.73 | 2.65 | 0.72 |
| Serum creatinine | mmol/L | 69.42 | 36.39 | 75.16 | 42.91 | 81.93 | 44.02 | 90.83 | 50.75 | 98.52 | 49.87 | 108.24 | 62.68 | 86.38 | 48.12 |
| Systolic BP | mmHg | 124.31 | 12.23 | 127.41 | 12.92 | 130.62 | 46.66 | 132.33 | 13.58 | 134.23 | 55.43 | 132.57 | 14.94 | 130.93 | 35.64 |
| Diastolic BP | mmHg | 76.25 | 7.57 | 76.10 | 7.67 | 74.40 | 7.72 | 71.90 | 7.78 | 69.92 | 8.10 | 68.70 | 8.24 | 73.17 | 8.12 |
| Variable | “Poor” glycemic control (HbA1c > 8%) | ||||
|---|---|---|---|---|---|
| Unadjusted OR | 95% CI | Adjusted OR | 95% CI | ||
| [ ] depicts reference group; Adj OR: adjusted odds ratio; CI: confidence interval; NS: not significant. * P < 0.05 by stepwise logistic regression analysis | |||||
| Age, y | |||||
| < 45 | 6.67* | 5.61 - 7.94 | 4.21* | 3.38 - 5.26 | |
| 45 - 54 | 4.88* | 4.16 - 5.73 | 3.24* | 2.64 - 3.97 | |
| 55 - 64 | 2.99* | 2.55 - 3.50 | 2.12* | 1.74 - 2.59 | |
| 65 - 74 | 1.65* | 1.41 - 1.94 | 1.31* | 1.07 - 1.59 | |
| 75 - 84 | 1.28* | 1.08 - 1.51 | 1.12 | 0.91 - 1.37 | |
| [85+] | 1 | 1 | |||
| Gender | |||||
| Male | 1.14* | 1.09 - 1.20 | 1.21* | 1.15 - 1.27 | |
| [Female] | 1 | 1 | |||
| Race | |||||
| [Chinese] | 1 | 1 | |||
| Malay | 2.12* | 2.01 - 2.24 | 1.65* | 1.54 - 1.77 | |
| Indian | 2.05* | 1.94 - 2.17 | 1.50* | 1.40 - 1.61 | |
| Others | 1.59* | 1.43 - 1.77 | 1.31* | 1.15 - 1.49 | |
| Other Medical Conditions | |||||
| Maculopathy/Retinopathy | (Yes) | 2.14* | 2.01 - 2.27 | 1.47* | 1.36 - 1.59 |
| [No] | 1 | 1 | |||
| Peripheral vascular disease | (Yes) | 1.77* | 1.61 - 1.93 | 1.27* | 1.12 - 1.43 |
| [No] | 1 | 1 | |||
| Coronary heart disease | (Yes) | 0.99 | 0.95 - 1.05 | 1.15* | 1.08 - 1.23 |
| [No] | 1 | 1 | |||
| Heart failure | (Yes) | 1.39* | 1.24 - 1.54 | 1.46* | 1.27 - 1.68 |
| [No] | 1 | 1 | |||
| Ischemic stroke | (Yes) | 0.97 | 0.87 - 1.10 | 1.22* | 1.06 - 1.40 |
| [No] | 1 | 1 | |||
| Stage of chronic kidney disease | |||||
| [Stage 1] | 1 | 1 | |||
| Stage 2 | 0.54* | 0.52 - 0.57 | 0.63* | 0.60 - 0.67 | |
| Stage 3 | 0.61* | 0.57 - 0.65 | 0.69* | 0.64 - 0.75 | |
| Stage 4 | 0.99 | 0.87 - 1.12 | 0.75* | 0.64 - 0.88 | |
| Stage 5 | 0.81 | 0.60 - 1.09 | 0.32* | 0.22 - 0.47 | |
| Diabetes Treatment and Control of Risk Factors | |||||
| Insulin | (Yes) | 8.09* | 7.67–8.53 | 8.19* | 7.70–8.73 |
| [No] | 1 | 1 | |||
| LDL-c control, mmol/L | |||||
| [<2.6] | 1 | 1 | |||
| 2.6 – 3.3 | 1.33* | 1.26–1.39 | 1.42* | 1.34–1.50 | |
| 3.4 – 4.0 | 2.22* | 2.07–2.39 | 2.42* | 2.24–2.62 | |
| 4.1+ | 4.20* | 3.83–4.62 | 4.30* | 3.87–4.78 | |
| Blood pressure control | |||||
| [Normal] | 1 | 1 | |||
| High Normal | 1.06 | 1.00–1.11 | 1.10* | 1.04–1.17 | |
| Grade 1 Hypertension | 1.06 | 1.00–1.13 | 1.20* | 1.12–1.70 | |
| Grade 2 Hypertension | 1.27* | 1.13–1.43 | 1.47* | 1.27–1.70 | |
| Body Mass Index (BMI) | |||||
| Underweight | 0.80* | 0.66–0.95 | 1.24 | 0.99–1.54 | |
| [Normal] | 1 | 1 | |||
| Overweight | 1.26 | 1.19–1.32 | 1.31* | 1.15–1.49 | |
| Obese Class 1 | 1.63* | 1.52–1.74 | 1.29* | 1.20–1.39 | |
| Obese Class 2 | 1.94* | 1.75–2.14 | 1.39* | 1.27–1.53 | |