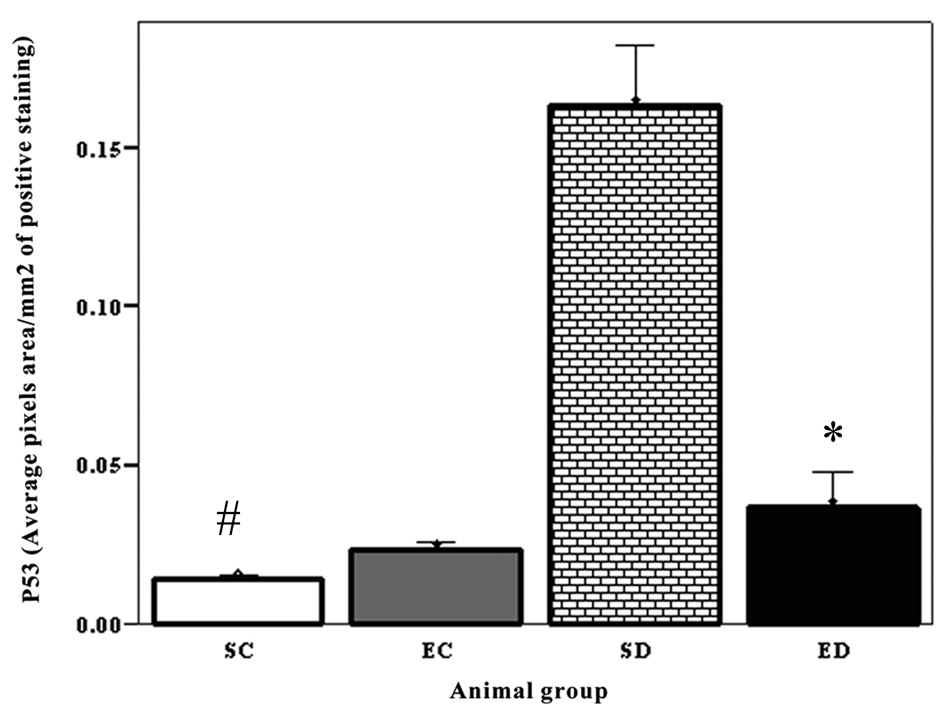
Figure 1. Expression of P53 in the cardiac muscle. The expression level of p53 increased significantly in the diabetic sedentary group compared to sedentary control groups (P < 0.02, #). Exercise training significantly decreased the expression level of P53 (P < 0.005), SC: Sedentary Control. EC: Exercised Control. SD: Sedentary Diabetic. ED: Exercise Diabetic.
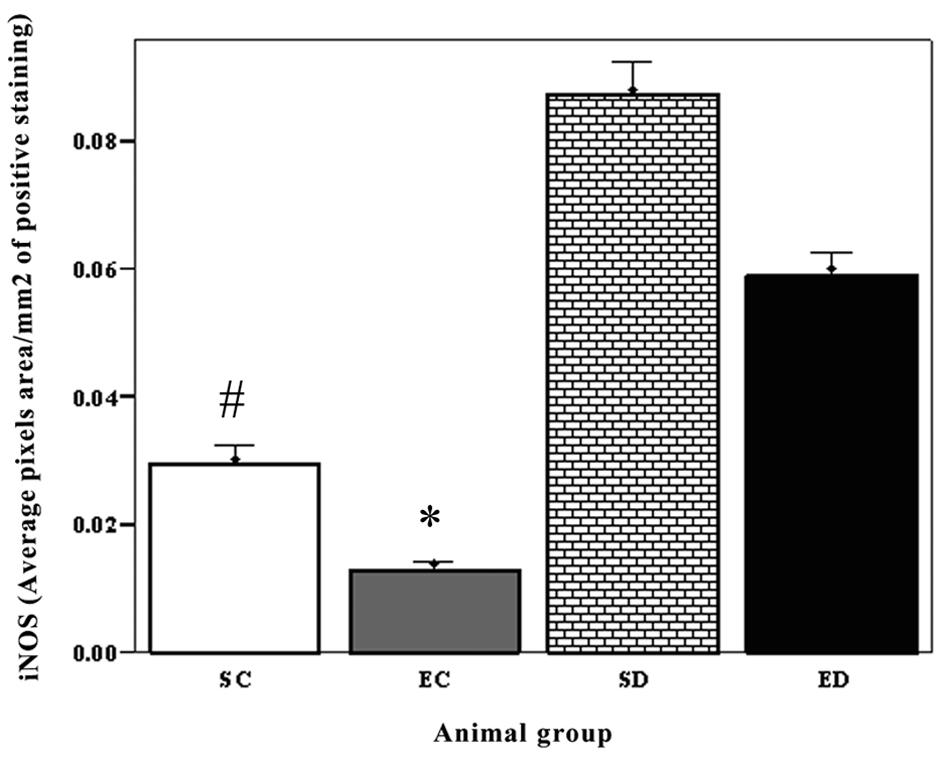
Figure 2. The expression of iNOS in cardiac muscle. The expression of iNOS showed significant increase in the sedentary diabetic rats compared to the sedentary control group (P < 0.03, #). There was a significant difference between exercise control and exercised diabetic group (P < 0.01). Exercise decreased the level of iNOS in the diabetic groups, but this decrease was not significant (P < 0.07). SC: Sedentary Control. EC: Exercised Control. SD:Sedentary Diabetic. ED: Exercise Diabetic.