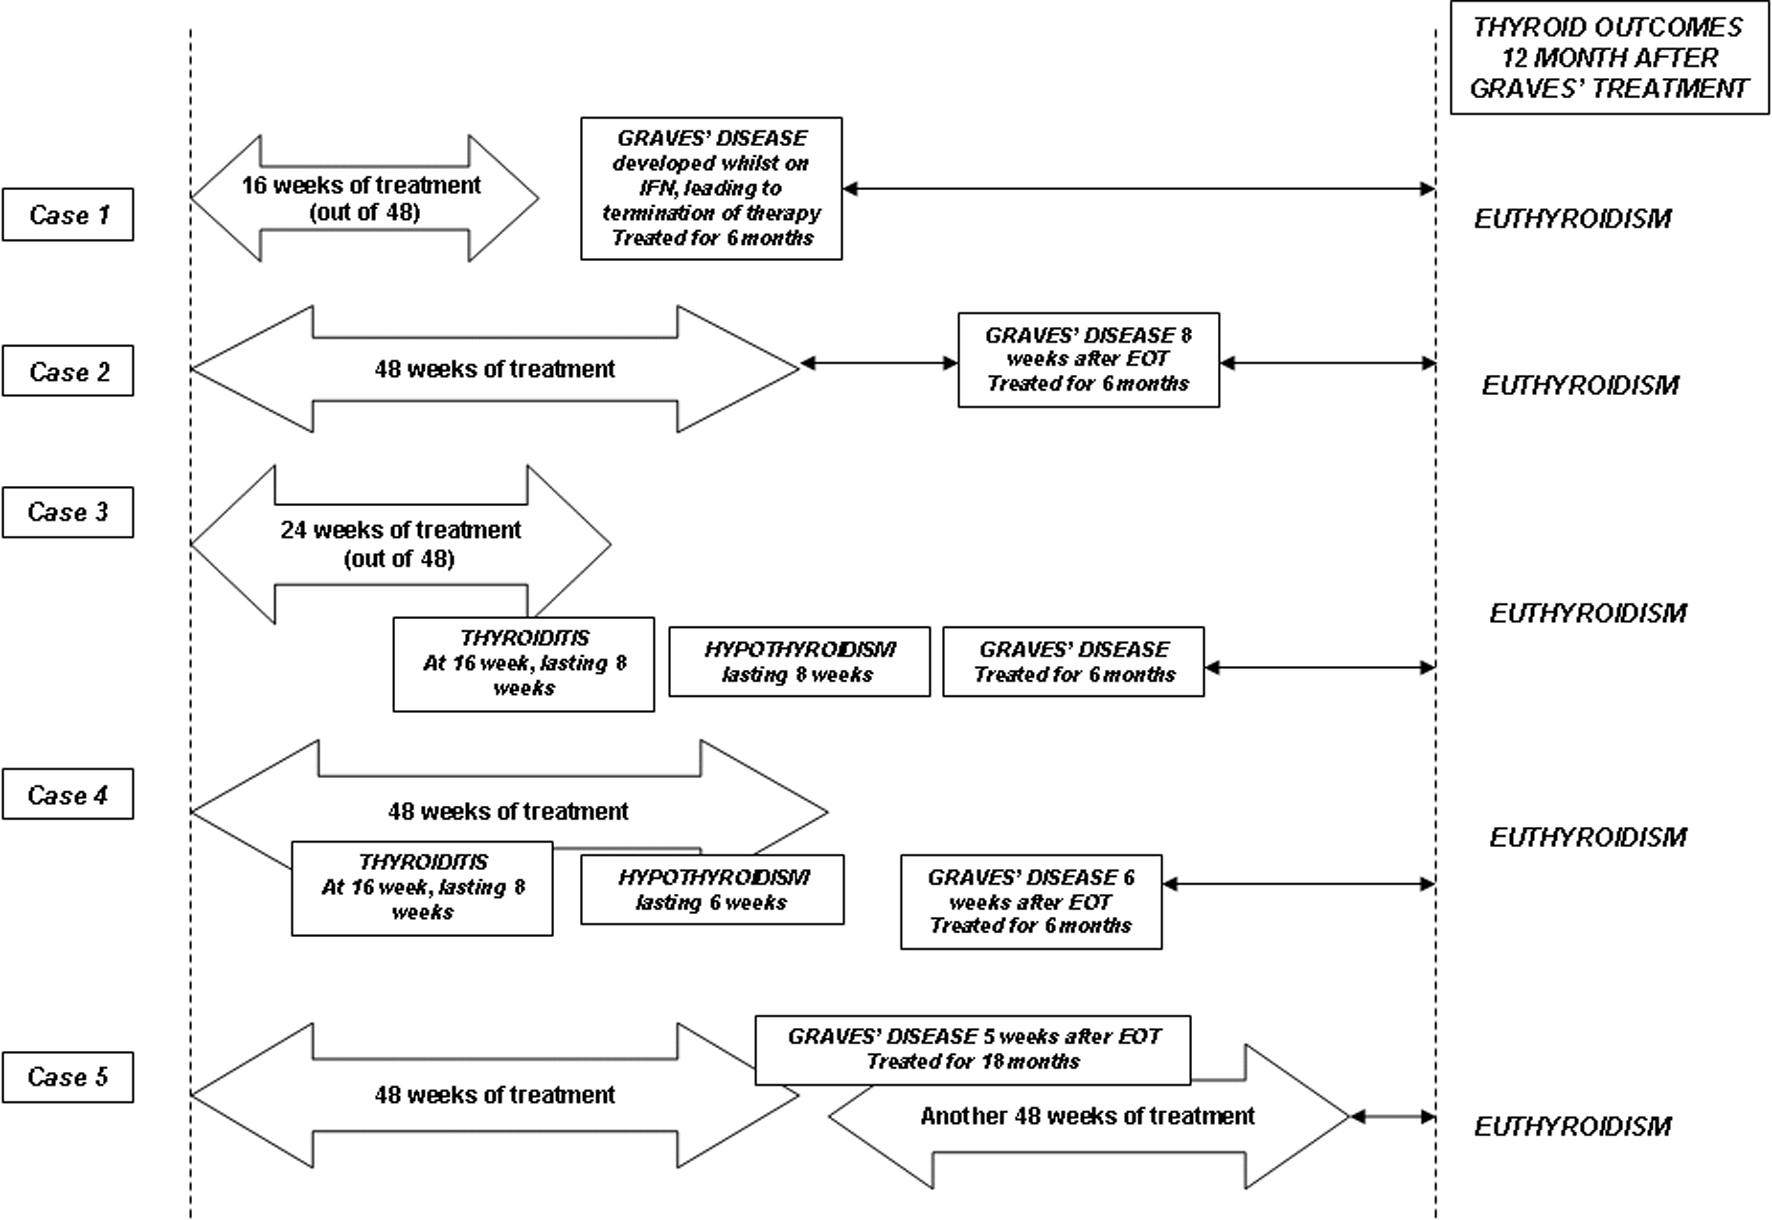
Figure 1. Schematic summaries of the cases and their final thyroid outcomes. The arrow bars indicate the duration of combination therapy with interferon-α and ribavirin. See text for detailed discussions.
| Journal of Endocrinology and Metabolism, ISSN 1923-2861 print, 1923-287X online, Open Access |
| Article copyright, the authors; Journal compilation copyright, J Endocrinol Metab and Elmer Press Inc |
| Journal website http://www.jofem.org |
Original Article
Volume 1, Number 1, April 2011, pages 14-20
Characteristics of Graves’ Disease in a Cohort of Chronic Hepatitis C Patients Treated With Interferon-α and Ribavirin
Figure
Tables
| Subject No. | Gender/Age | Ethnicity | Treatment Duration | Thyroid Scan | Final Diagnosis | Treatment | Long Term Outcome (12 months after end of treatment) |
|---|---|---|---|---|---|---|---|
| CBZ, Carbimazole. | |||||||
| 1 | F/53 | C | 16 | Toxic nodule & diffuse uptake 6% | Mixed Graves’ disease and toxic solitary nodule | CBZ for 6 months | Euthyroidism |
| 2 | M/47 | C | 48 | 8% diffuse uptake | Graves’ disease | CBZ for 6 months | Euthyroidism |
| 3 | Phase 1 (thyroiditis phase) | Negligible uptake | Triphasic thyroiditis, Graves’ disease | Symptomatic treatment | Euthyroidism | ||
| F/43 | C | 24 | |||||
| Phase 2 (thyrotoxic phase) | 5% diffuse uptake | CBZ for 6 months | |||||
| 4 | Phase 1 (thyroiditis phase) | Negligible uptake | Triphasic thyroiditis, Graves’ disease | Symptomatic treatment | Euthyroidism | ||
| M/53 | C | 48 | |||||
| Phase 2 (thyrotoxic phase) | 8% diffuse uptake | CBZ for 6 months | |||||
| 5 | F/49 | C | 48 | 9% diffuse uptake | Graves’ disease | CBZ for 12 months | Euthyroidism |
| Subject No. | Anti-thyroglobulin | Anti-thyroperoxidase | hTRAb | |||
|---|---|---|---|---|---|---|
| Before | After | Before | After | Before | After | |
| The ‘After’ antibody levels are measured after 6 months (at the end) of therapy. | ||||||
| 1 | 10 | 12 | 271 | 41 | 30.2 | < 2 |
| 2 | 8 | 11 | 149 | 28 | 16.6 | < 2 |
| 3 | 1597 | 89 | 1176 | 78 | 3.3 | < 2 |
| 4 | 22 | 26 | 258 | 75 | 19.3 | < 2 |
| 5 | 41 | 68 | 38 | 25 | 13.9 | 5.8 |