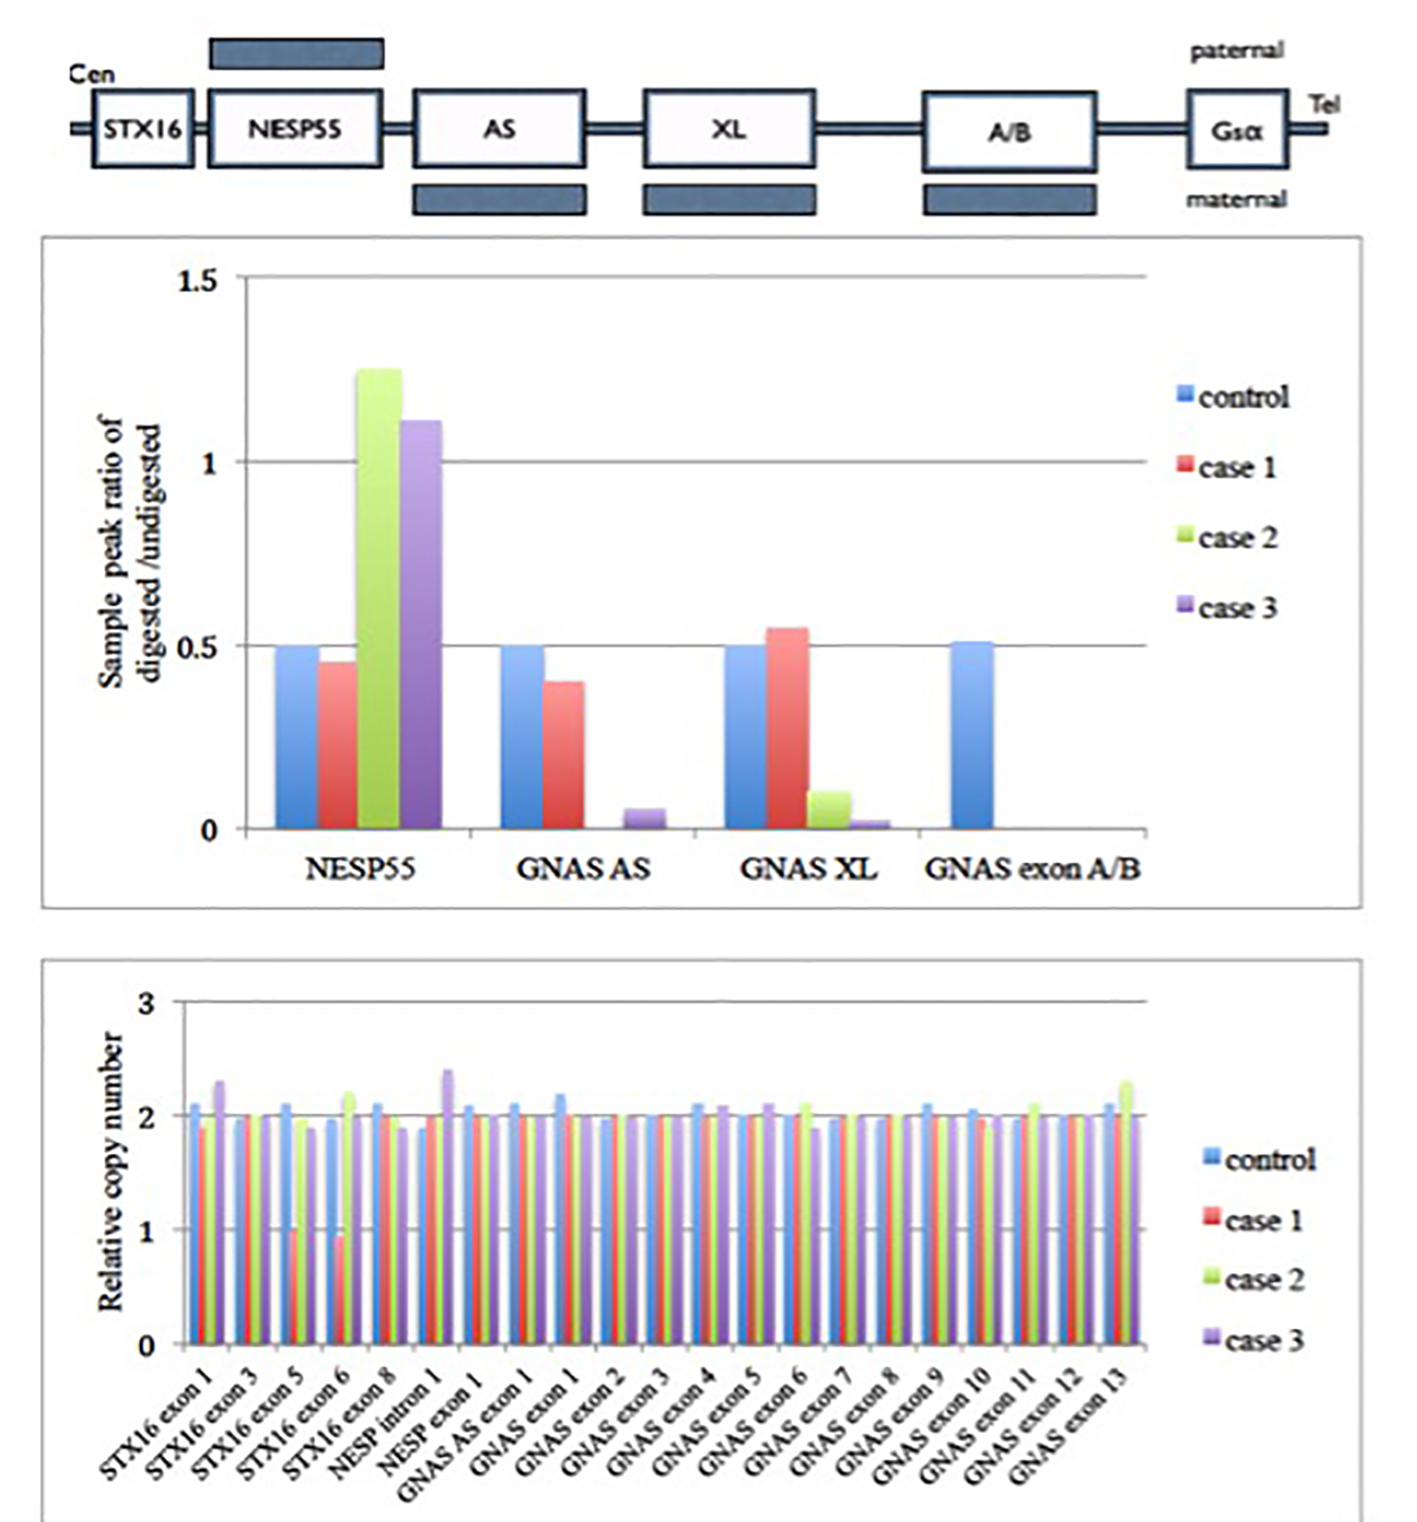
Figure 1. MS-MLPA (GNAS locus) results of these three cases. Upper panel shows a schematic representation of the GNAS locus region. Shaded bars represent the methylation state. Middle panel shows the methylation status of each differential methylation regions (DMRs) at the GNAS locus. The y axis is the ratio of digested to undigested signal change by restriction endonuclease enzyme over GNAS locus. In normal condition, the ratio should be 0.5. Value greater than 0.5 means hypermethylation and less than 0.5 means hypomethylation change over that region. There was hypomethylation at GNAS exon A/B in case 1 patient. There were hypermethylation at the NESP55 and hypomethylation at GNAS AS, GNAS XL and GNAS exon A/B of the patient as compared with control in cases 2 and 3 patients. Lower panel shows the relative copy number change in different exons of GNAS locus. It shows there is deletion of exon 5 and 6 in STX16 gene for case 1. There was no copy number change in GNAS locus among case 2 and 3. Gαs: α subunit of the stimulatory G protein; XLαs: Gαs extra-large variant; NESP55: neuroendocrine protein 55; A/B: untranslated exon A/B; AS: antisense transcript.
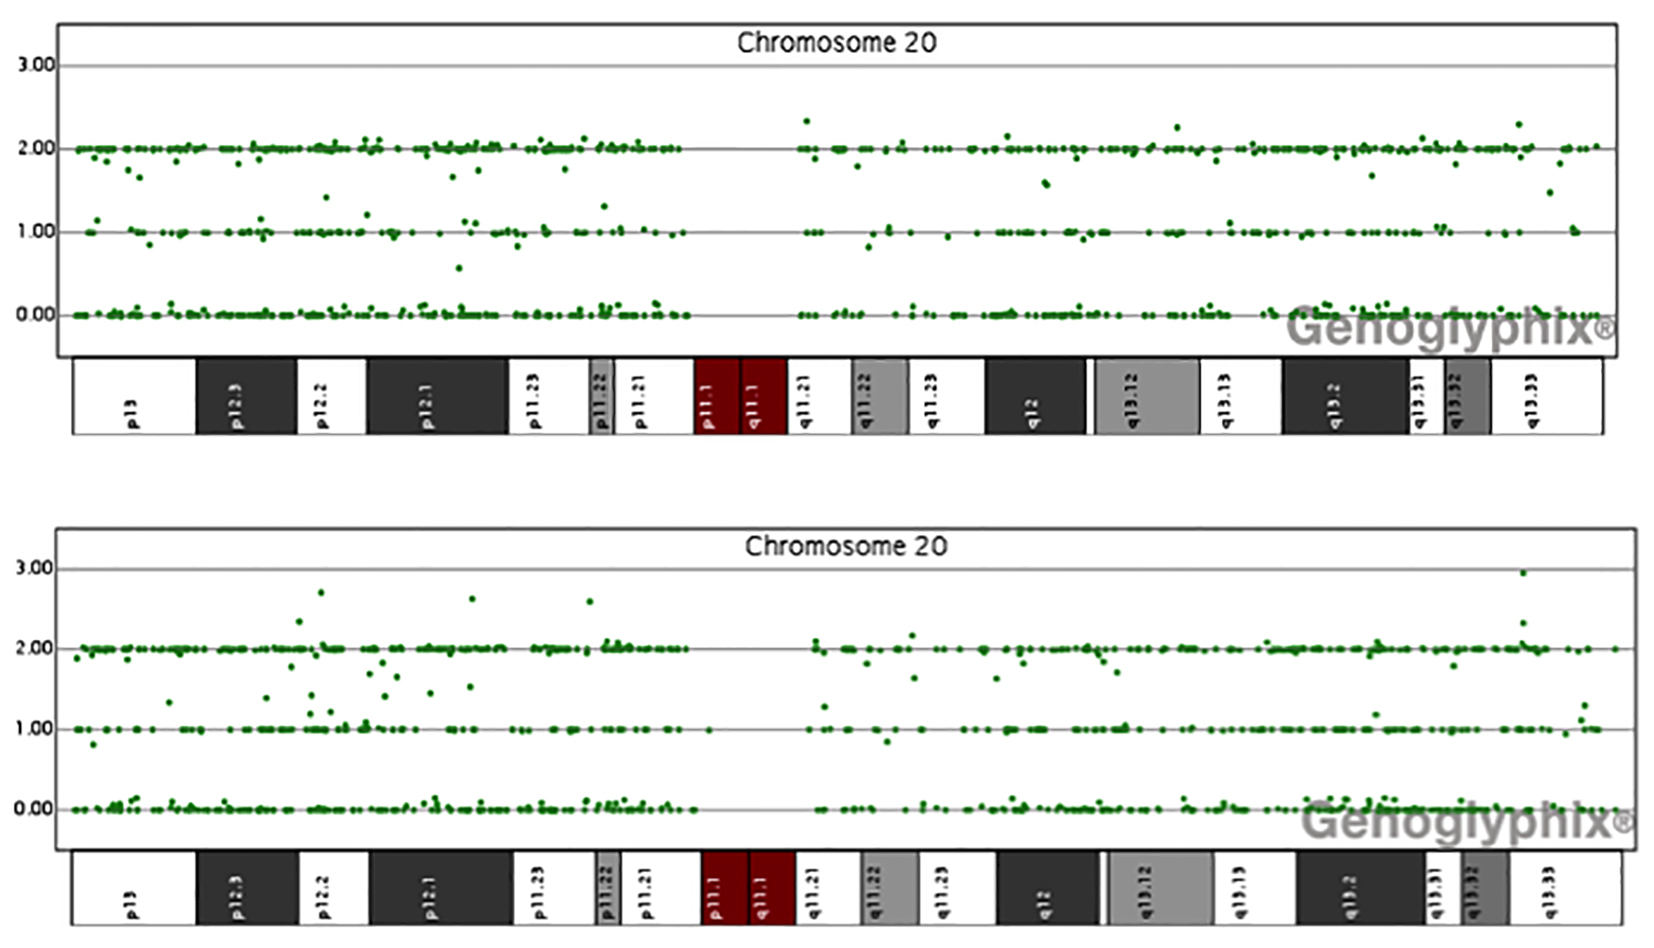
Figure 2. Data of single nucleotide polymorphism (SNP) array of chromosome 20 for patients 2 and 3. The y axis is the number of uncut alleles and x axis represents different region of chromosome 20. In normal condition, there are three lines of signals. In uniparental disomy, the central line signal will lose. Here it shows no evidence of paternal uniparental disomy of chromosome 20 in all our sporadic PHP-1b patients.
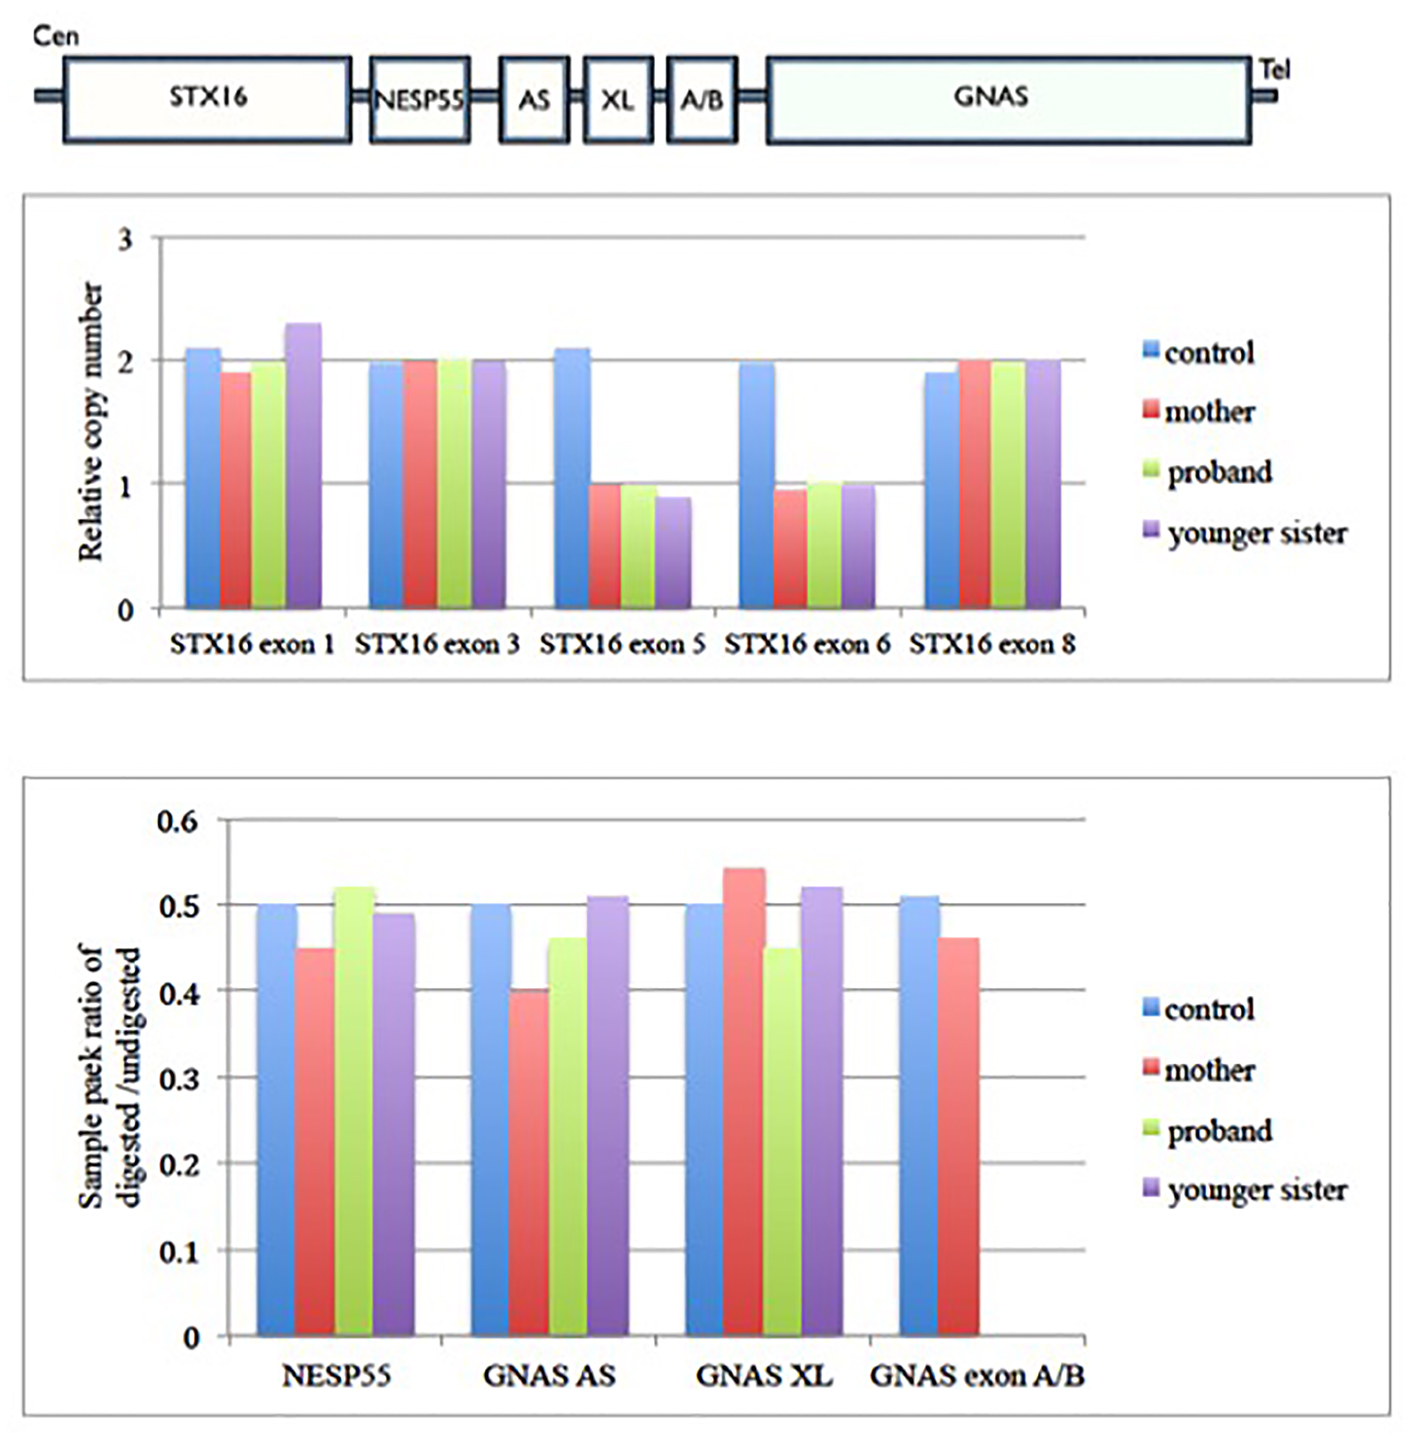
Figure 3. Family cascade screening for case 1 family. Upper panel shows the architecture of GNAS imprinting locus. Middle panel shows the relative copy number change in each exons of STX16 gene in case 1 family. It shows there is deletion of exon 5 and 6 of STX16 gene in proband, her mother and younger sister. Lower panel shows the methylation status of each differential methylation regions (DMRs) at the GNAS locus among this family. The y-axis is the ratio of digested to undigested signal change by restriction endonuclease enzyme over GNAS locus. In normal condition, the ratio should be 0.5. Value greater than 0.5 means hypermethylation and less than 0.5 means hypomethylation change over that region. There was hypomethylation at GNAS exon A/B in proband and her younger sister, but normal methylation status in their mother. Gαs: α subunit of the stimulatory G protein; XLαs: Gαs extra-large variant; NESP55: neuroendocrine protein 55; A/B: untranslated exon A/B; AS: antisense transcript.