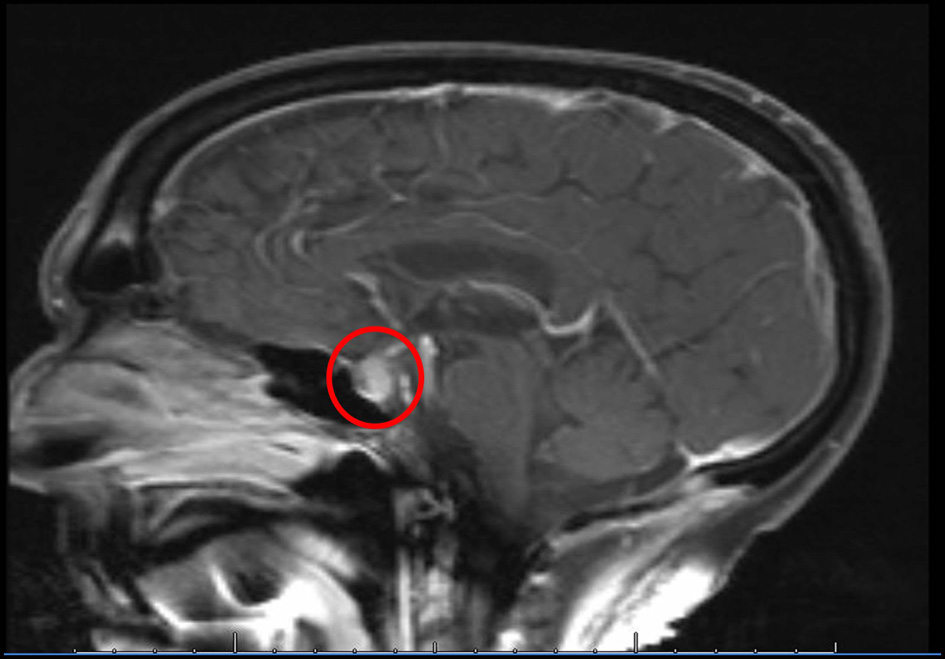
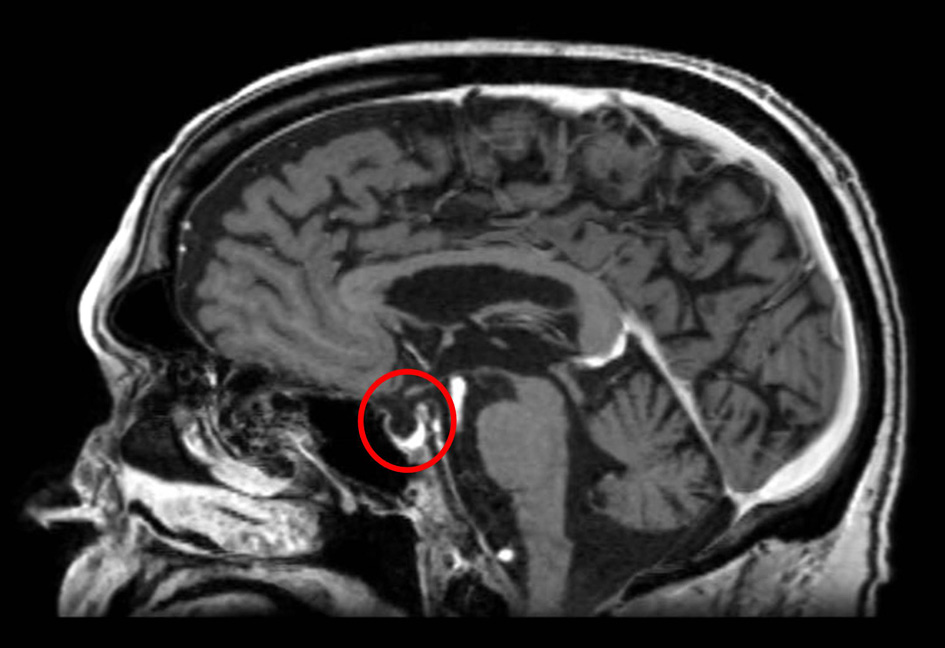
Figure 1. MRI of the brain performed at the time of diagnosis of IH demonstrates soft tissue fullness of the pituitary with heterogeneous enhancement after contrast.
| Journal of Endocrinology and Metabolism, ISSN 1923-2861 print, 1923-287X online, Open Access |
| Article copyright, the authors; Journal compilation copyright, J Endocrinol Metab and Elmer Press Inc |
| Journal website http://www.jofem.org |
Case Report
Volume 5, Number 5, October 2015, pages 299-303
Ipilimumab-Induced Hypophysitis May Not Affect All Pituitary Cell Lines: A Case Report
Figures
Table
| Laboratory investigations | Prior to ipilimumab | At diagnosis of IH | At 5-month follow-up | At 8-month follow-up | At 14-month follow-up | Reference range |
|---|---|---|---|---|---|---|
| Total testosterone (ng/dL) | Not tested | 11 | < 10 | 165 | 150 | 241 - 827 |
| TSH (μIU/mL) | 0.88 | 0.09 | 0.06 | Not tested | 0.09 | 0.28 - 3.89 |
| Free T4 (ng/dL) | 1.19 | 1.15 | 1.5 | Not tested | 0.83 | 0.58 - 1.64 |
| Total T3 (ng/dL) | 101 | 74 | Not tested | Not tested | Not tested | 97 - 178 |
| AM Cortisol (μg/dL) | Not tested | 0.09 | 1.4 | Not tested | 0.9 | 6.7 - 22.6 |
| ACTH (pg/mL) | Not tested | Not tested | < 5 | Not tested | 5 | < 46 |
| ACTH stimulation test (μg/dL) | Not tested | Not tested | 1.4, 9.2, 11.4 | Not tested | Not tested | ≥ 18 |
| Prolactin (ng/mL) | Not tested | Not tested | 0.6 | Not tested | 0.7 | 2.6 - 13.3 |
| IGF-1 (ng/dL) | Not tested | Not tested | 40 | Not tested | Not tested | 17 - 246 |
| LH (mIU/mL) | Not tested | Not tested | 1.4 | Not tested | Not tested | 1.2 - 8.6 |
| Serum osmolality, urine osmolality and serum electrolytes | Within normal range | Within normal range | Within normal range | Within normal range | Within normal range |