Journal of Endocrinology and Metabolism, ISSN 1923-2861 print, 1923-287X online, Open Access
Article copyright, the authors; Journal compilation copyright, J Endocrinol Metab and Elmer Press Inc
Journal website http://www.jofem.org

Original Article

Volume 4, Number 1-2, April 2014, pages 13-24


Outpatient Diabetic Care in a Public Central Hospital: Patient Characteristics, Therapeutic Regimens and Results

Figures

Figure 1.
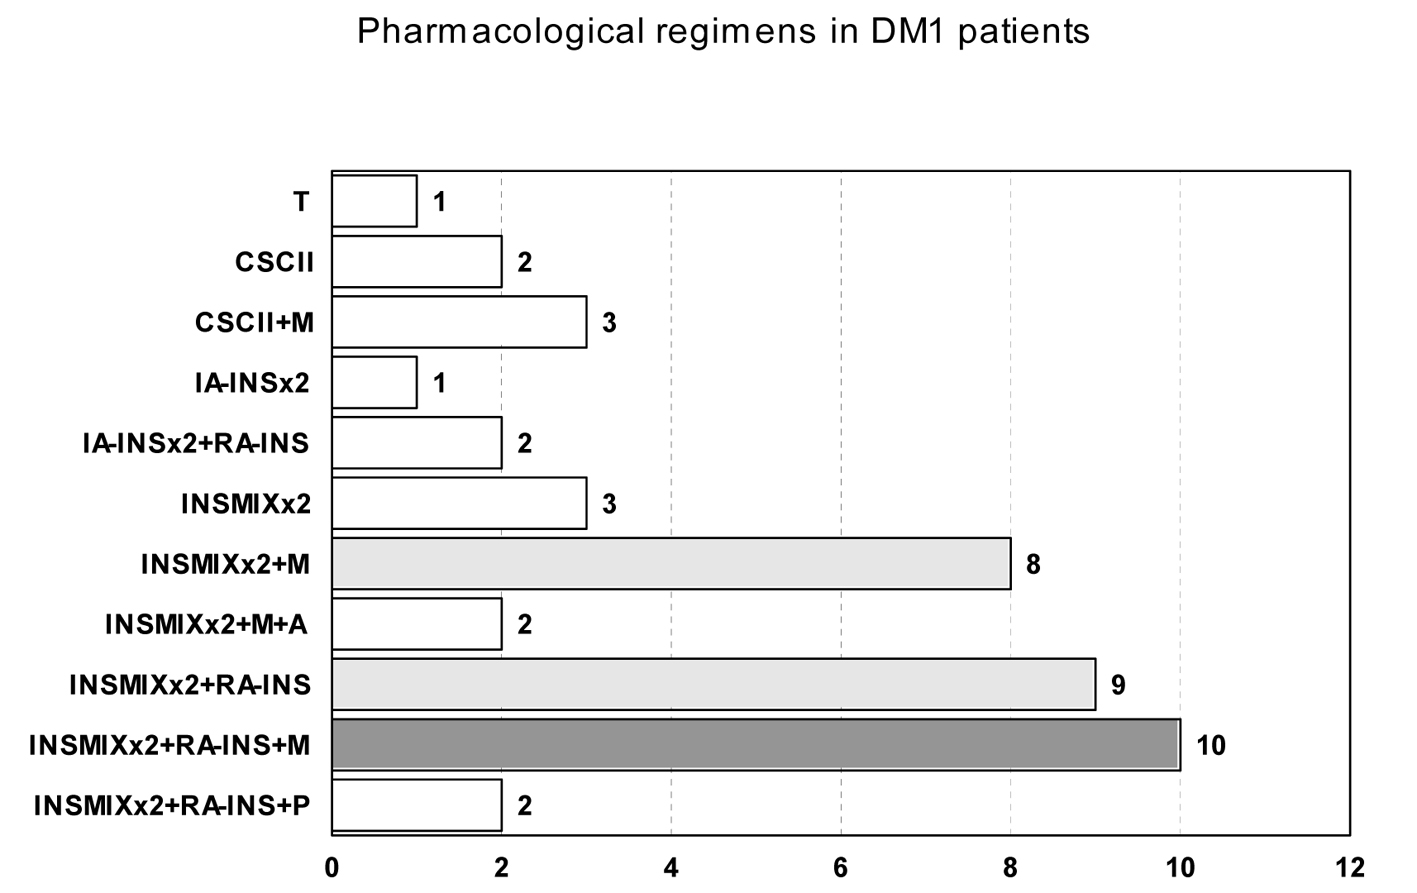
Figure 1. Pharmacological regimens in DM1 patients. T: pancreas transplant; CSCII: continuous subcutaneous insulin infusion; IA-INS: intermediate acting insulin; RA-INS: rapid acting insulin; INSMIXT: pre-mixed insulin with intermediate acting insulin and 10, 20 or 30% of rapid acting insulin; M: metformin; P: pioglitazone; A: acarbose; S: sulphonylurea; NT: nateglinide; N: without pharmacological drug therapy. Number of patients with each regimen is presented in the horizontal axis. The most common regime is filled dark gray and the other common regimens are filled light gray.
Figure 2.
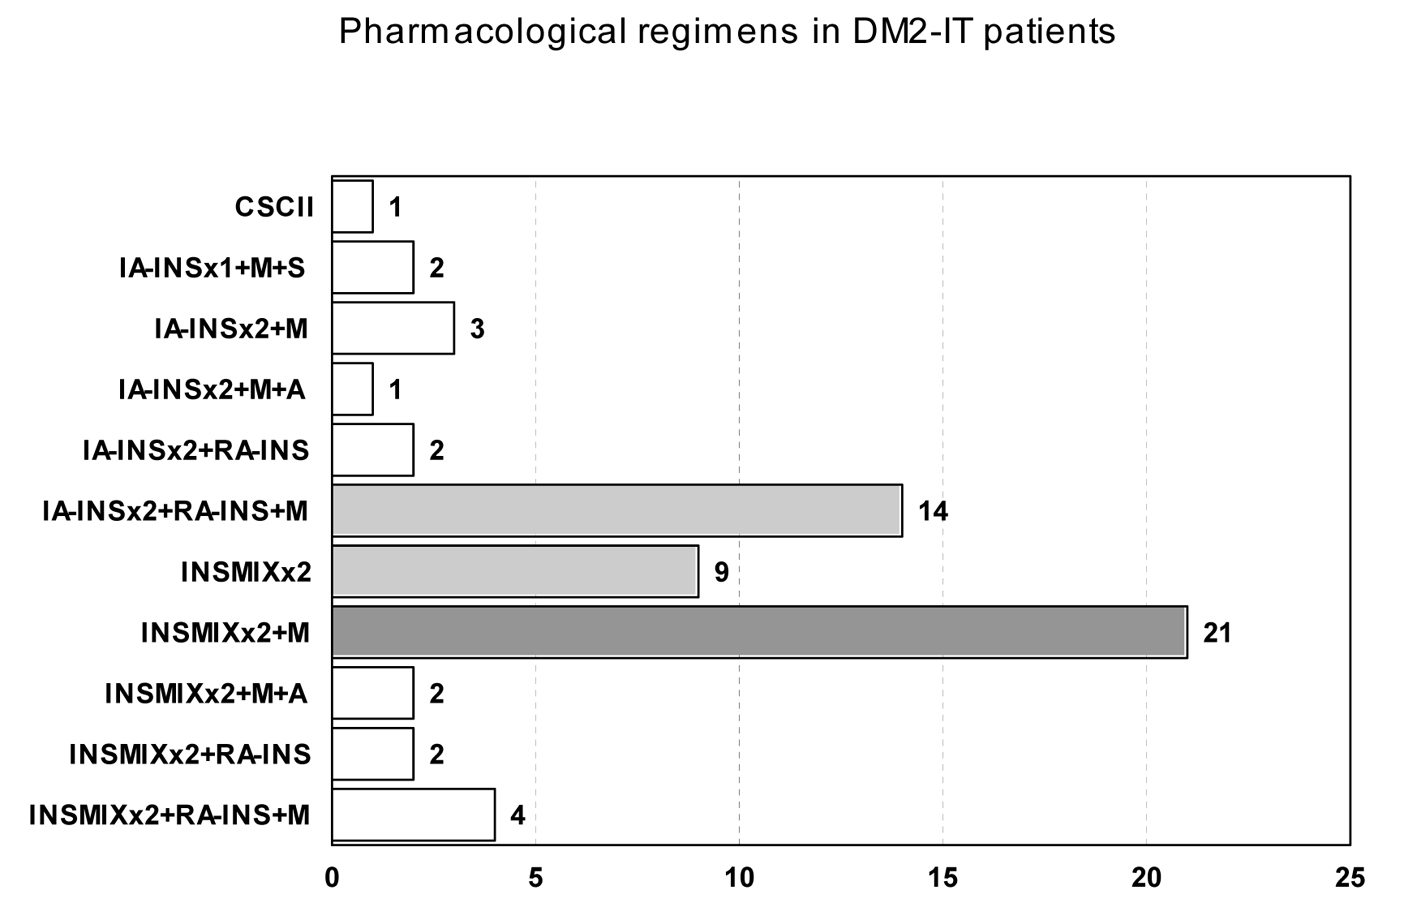
Figure 2. Pharmacological regimens in DM2-IT patients. T: pancreas transplant; CSCII: continuous subcutaneous insulin infusion; IA-INS: intermediate acting insulin; RA-INS: rapid acting insulin; INSMIXT: pre-mixed insulin with intermediate acting insulin and 10, 20 or 30% of rapid acting insulin; M: metformin; P: pioglitazone; A: acarbose; S: sulphonylurea; NT: nateglinide; N: without pharmacological drug therapy. Number of patients with each regimen is presented in the horizontal axis. The most common regime is filled dark gray and the other common regimens are filled light gray.
Figure 3.
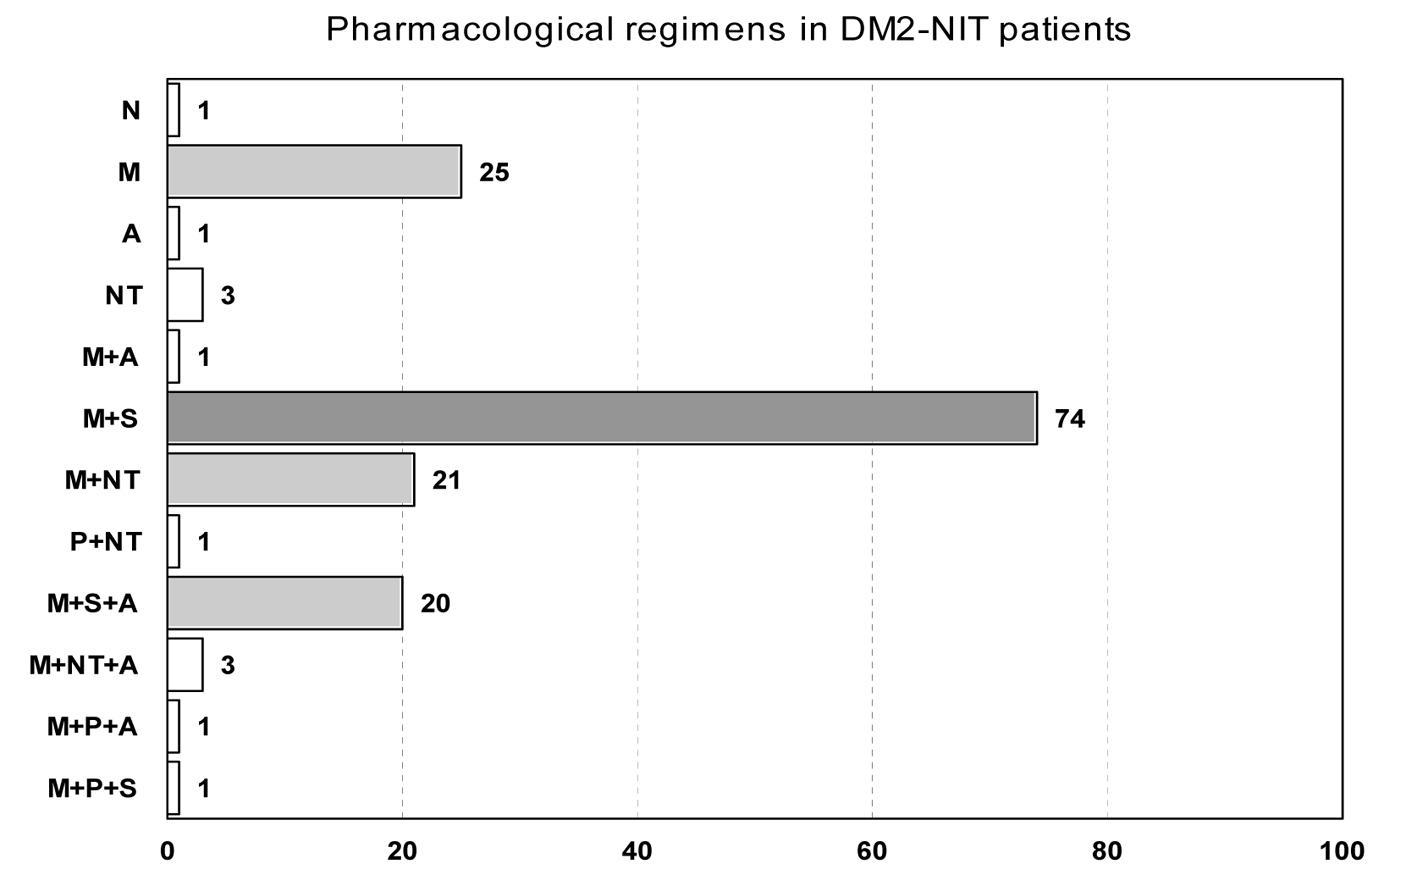
Figure 3. Pharmacological regimens in DM2-NIT patients. T: pancreas transplant; CSCII: continuous subcutaneous insulin infusion; IA-INS: intermediate acting insulin; RA-INS: rapid acting insulin; INSMIXT: pre-mixed insulin with intermediate acting insulin and 10, 20 or 30% of rapid acting insulin; M: metformin; P: pioglitazone; A: acarbose; S: sulphonylurea; NT: nateglinide; N: without pharmacological drug therapy. Number of patients with each regimen is presented in the horizontal axis. The most common regime is filled dark gray and the other common regimens are filled light gray.

Tables

Table 1. Patient Clinical Characteristics
 
Results are presented as %, or as the mean ± standard deviation and between parenthesis the range.
Gender (M/F) (%)48/52
Age (years)55 ± 16 (9 - 85)
Years since diagnosis11 ± 9 (1 - 41)
BMI (kg/m2)28.0 ± 5.7 (17.1 - 51.6)
Underweight (BMI < 18 kg/m2) (%)2
Overweight (25 < BMI < 30 kg/m2) (%)32
Obesity (BMI > 30 kg/m2) (%)30
Retinopathy (%)35
Cataracts (%)38
Nephropathy (%)40
Cystopathy (%)10
Gastroenteropathy (%)3
Peripheral neuropathy (%)33
Diabetic foot (%)3
High blood pressure (%)56
Dyslipidemia (%)61
Ischemic heart disease (%)13
Cerebrovascular disease (%)3
Peripheral vascular disease (%)24


Table 2. Rate of Microvascular Complications Across Diagnostic Categories
 
DM1DM2-ITDM2-NIT
Retinopathy (%)335329
Cataracts (%)66044
Nephropathy (%)345935
Autonomic cystopathy (%)5217
Autonomic gastroenteropathy (%)733
Peripheral neuropathy (%)214034
Diabetic foot (%)163


Table 3. Rate of Macrovascular Disease Across Diagnostic Categories
 
DM1DM2-ITDM2-NIT
High blood pressure (%)217163
Dyslipidemia (%)506663
Ischemic heart disease (%)21617
Cerebrovascular disease (%)073
Peripheral vascular disease (%)73127


Table 4. Selected Biochemical Parameters Across Diagnostic Groups
 
DM1DM2-ITDM2-NIT
VS (mm)11 ± 934 ± 3113 ± 23
CRP (mg/dL)0.25 ± 0.470.54 ± 0.640.43 ± 0.54
Homocysteine (mmol/L)7 ± 212 ± 613 ± 5
Fibrinogen (mg/dL)320 ± 56369 ± 53342 ± 135
ACTH (pg/mL)23 ± 1523 ± 1422 ± 12
Cortisol (µg/dL)19 ± 716 ± 820 ± 7
Renin (pg/mL)19 ± 1027 ± 1926 ± 34
Aldosterone (pg/mL)124 ± 117106 ± 73106 ± 66
C-peptide (ng/mL)0.9 ± 0.51.9 ± 0.92.8 ± 1.3
Cortisol (µg, 24 h urine)78 ± 39109 ± 4991 ± 43
Aldosterone (µg, 24 h urine)18 ± 2020 ± 2914 ± 20
C-peptide (µg, 24 h urine)15 ± 2656 ± 5993 ± 56


Table 5. Results of Medical Treatment
 
DM1DM2-ITDM2-NIT
SBP: systolic blood pressure; DBP: diastolic blood pressure.
HbA1c (%)7.4 ± 1.69.3 ± 2.48.6 ± 1.6
HbA1c < 7% (%)45815
HbA1c < 8% (%)713034
Δ HbA1c (first-last visit)0.6 ± 1.7-0.4 ± 2.30.7 ± 1.8
Serum glucose (mg/dL)157 ± 65181 ± 93169 ± 81
Δ weight (kg) (first-last visit)1 ± 4-2 ± 7-2 ± 5
SBP (mmHg)136 ± 21117 ± 24136 ± 16
SBP ≤ 130 mmHg (%)558453
DBP (mmHg)73 ± 1465 ± 1372 ± 9
DBP ≤ 80 mmHg (%)848889
Serum cholesterol (mg/dL)191 ± 42192 ± 60195 ± 38
Serum cholesterol ≤ 200 mg/dL (%)647564
Serum triglycerides (mg/dL)152 ± 90114 ± 160169 ± 96
Serum triglycerides ≤ 150 mg/dL (%)588951
Serum HDLc (mg/dL)54 ± 1766 ± 2256 ± 26
Serum HDL ≥ 45 mg/dL (%)638572