


| Journal of Endocrinology and Metabolism, ISSN 1923-2861 print, 1923-287X online, Open Access |
| Article copyright, the authors; Journal compilation copyright, J Endocrinol Metab and Elmer Press Inc |
| Journal website http://www.jofem.org |
Original Article
Volume 1, Number 3, August 2011, pages 101-112
Continuous and Intermittent Exercise Training and Glucose Metabolism in Neonatal Alloxan Administered Rats
Carla Ribeiroa, b, Lucieli Teresa Cambria, Rodrigo Augusto Daliaa, Michel Barbosa de Araujoa, Jose Alexandre Curiacos de Almeida Lemea, Rodrigo Ferreira de Mouraa, Fabricio Azevedo Voltarellia, Maria Alice Rostom de Melloa
aDepartment of Physical Education, Sao Paulo State University (UNESP), Rio Claro-SP, Brazil
bCorresponding author: Avenue. 24 A, 1515, Bela Vista, Rio Claro-SP, CEP 13506-900, Brazil
Manuscript accepted for publication August 1, 2011
Short title: Exercise Training and Glucose Metabolism
doi: https://doi.org/10.4021/jem32w
| Abstract | ▴Top |
Background: This study aimed to compare the effects of intermittent and continuous swimming training on glucose metabolism in neonatal alloxan treated rats.
Methods: Alloxan was injected in newborn rats at 6 days of age (250 mg/kg bw). At 28 days of age, the animals were divided into sedentary alloxan (SA), sedentary control (SC), continuous trained alloxan (CA), intermittent trained alloxan (IA), continuous trained control (CC) and intermittent trained control (IC) groups. The continuous training protocol consisted of 12 weeks swimming (1 h/day), uninterrupted, five days a week, in individual cylinder tanks (25 cm diameter × 50 cm depth), and with supporting overload of 5% bw. Intermittent training consisted of 12 weeks of swimming (30 s), interrupted by rest (30 s), in individual cylinder tanks (25 cm diameter × 50 cm depth), for a total of 20 min/day, five days a week, and with an overload of 15% bw.
Results: At 28 days, the alloxan treated animals showed both a higher area under the curve (AUC) values for serum glucose during a glucose tolerance test (GTT) and a lower glucose disappearance rate (Kitt) during an insulin tolerance test (ITT), indicating insulin resistance in the first group. At 120 days, the alloxan treated animals subjected to the intermittent training showed higher serum glucose AUC than the controls after a GTT. The glucose uptake by isolated soleus muscle was higher in the animals trained by the intermittent protocol than in the others.
Conclusion: In conclusion, intermittent exercise was more effective than continuous exercise in improving glucose uptake by skeletal muscle.
Keywords: Neonatal rats; Alloxan; T2DM; Exercise training; Glucose uptake
| Introduction | ▴Top |
In recent years, the incidence of type 2 diabetes mellitus (T2DM) has considerably increased [1, 2]. T2DM is characterized by insulin resistance, which leads to characteristic hyperglycemia [2, 3]. This form of diabetes accounts for 90-95% of diabetes and can be triggered by various factors such as obesity, high calorie diet and physical inactivity [2, 4]. On the one hand, regular physical exercise, particularly in the treatment of this disease, improves glucose tolerance and improves insulin responsiveness [5-8]. The possible mechanisms by which exercise induces beneficial changes in insulin sensitivity include the development of muscle mass, increases in the peripheral glucose uptake and the reduction in the amount of insulin required for maintaining glucose homeostasis [9-11]. However, the discussion continues about the intensity of the effort, the training protocol and the periodicity to be prescribed for T2DM patients.
Unfortunately, there is a lack of direct evidence in the literature for the preventative effect of exercise on the development of T2DM, because this type of study is difficult to implement in human subjects. In this context, animal models provide more suitable conditions to study the issue. Chemically induced diabetic animals have been widely used as an experimental model for studies of the complications caused by diabetes [12] and the effects of physical exercises.
Portha et al. [13] described an experimental model of neonatal diabetes in Wistar rats, by application of streptozotocin on the day of birth. In this model, it was demonstrated that hyperglycemia is transitory. The blood glucose levels return to normal after the first week of life, with restoration of insulin production and β-cell mass. It features a T2DM model in rats, in which the experimental animals present good survival [13].
Later, Kodama et al. [14] developed another model, replacing streptozotocin with alloxan. In this study, alloxan was administered at 2, 4 or 6 days of life. When analyzed at 60 days of life, rats that received alloxan on the second day of life showed slightly higher blood glucose compared to controls in the fed state. Animals that received the drug on the fourth and sixth days of life showed significantly higher blood glucose than controls.
The authors considered this a useful model for studies on chronic complications of diabetes, however, they emphasized that more studies were needed to determine whether it has T2DM characteristics, as seen in the neonatal streptozotocin model.
Oliveira et al. [15] examined the fasting plasma glucose and glucose tolerance in alloxan treated rats (day 2) of both sexes at 30, 60, 90 days of age.
Fasting glucose was not different from control rats at any time. On the other hand, Contarteze et al. [16] showed that these animals presented higher blood glucose concentrations after an oral glucose load compared to controls. Ribeiro et al. [17], using rats that received alloxan at the 6th day of life, also showed higher blood glucose values during a glucose tolerance test in the alloxan treated animals compared to the control group, at both 28 and 60 days of age. Together, these data show that the neonatal induction model of diabetes is an interesting model in which to study the role of exercise in preventing and treating this disease.
Studies using different training protocols in the prevention and treatment of type 2 diabetes mellitus are scarce and show conflicting results. A study conducted with type 1 diabetics (T1DM), which compared the effects of intermittent training with high intensity of effort and continuous moderate training, showed that the reduction in blood glucose was less evident in the intermittent exercise group compared to the continuous moderate exercise group in individuals with T1DM [18].
Kuwajima et al. [19], using genetically modified animals (rats that develop obesity and glucose intolerance at 10 weeks of age), showed the prophylactic effect of continuous training in the development of T2DM. The cumulative incidence of T2DM in the sedentary group was 30, 67 and 78% at 10, 16 and 24 weeks of age, respectively. In the trained group, the T2DM incidence remained null throughout the experimental period.
Oliveira et al. [15] did not find any changes in skeletal muscle glucose uptake in rats subjected to neonatal application of alloxan after continuous swimming exercise of moderate intensity. Mota el al. [20], using the experimental model of T2DM with neonatal administration of alloxan, showed improvement in glucose tolerance in diabetic animals after 12 weeks of continuous swimming training, in the intensity of the maximal lactate steady state.
In adult, diabetic rats induced by streptozotocin application, continuous swimming exercise at different intensities, before and after the induction of diabetes, attenuated the hyperglycemia. The most pronounced effects were observed with the highest intensity of exercise [21].
In summary, both continuous training and intermittent training seem to play important roles in the prevention and treatment of type 2 diabetes mellitus, but further studies are needed to characterize the intensity and frequency best suited for each of these protocols. Thus, this study aims to compare the effects of intermittent and continuous swimming training, with equivalent loads, on the glucose metabolism in neonatal alloxan treated rats.
| Material and Methods | ▴Top |
Animals
Studies were carried out with newly born male Wistar rats, kept at 25 ± 1 °C under a 12/12 h light-dark cycle and fed a standard rodent chow and water ad libitum.During breastfeeding, food and water were offered ad libitum to the mothers, and the pups were distributed in litters of eight per dam. Food and water intake and body weight were recorded weekly, after the weekend. All experiments using animals were approved by the committee of ethics in animal research, Taubate University-CEEA/UNITAU, under protocol no. 019/08.
Neonatal alloxan administration
At 6 days of age, male pups, with a body weight of 11.9 ± 1.2 g, received an alloxan monohydrate injection (Sigma-Aldrich Inc., St Louis, MO, USA), which was dissolved in citrate buffer 0.01 M, pH 4.5 [22] and delivered intraperitoneally (250mg/kg body weight) after a 15-h fast. Age-matched controls were injected with vehicle alone (citrate buffer). Pups were immediately distributed in such a way that each mother nursed eight pups.
Experimental groups and design
At 28 days of age, the animals were randomly divided into the following six groups and remained in observation until 120 days of age (Fig. 1):
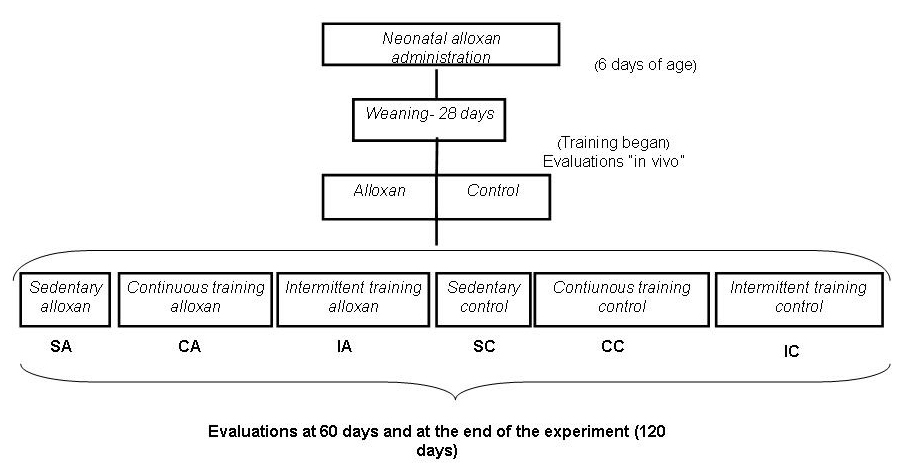 Click for large image | Figure 1. Experimental design. |
Control (C): citrate buffer-injected rats not subjected to exercise training;
Continuous Training Control (CC): citrate buffer-injected rats subjected to continuous exercise training protocol;
Intermittent Training Control (IC): citrate buffer-injected rats subjected to intermittent exercise training protocol;
Alloxan (A): alloxan-injected rats not subjected to exercise training;
Continuous Training Alloxan (CA): alloxan-injected rats subjected to continuous exercise training protocol;
Intermittent Training Alloxan (IA): alloxan-injected rats subjected to intermittent exercise training protocol.
Exercise training
The rats were initially acclimated to the water, with the objective of reducing the stress caused by physical exercise performed in this environment. The acclimation began with 5, 10, and 15 min in shallow water, moving to 5, 10, and 15 min in deep water, and subsequently 5 min with a bag tied to the thorax and 5, 10, and 15 min with a bag tied to the chest, which contained an overload of 3% of the body weight, before initiation of the training. The animals trained for the continuous exercise protocol were subjected to swimming, beginning at weaning and continuing until 120 days of age, as follows: 1 hour per day uninterrupted, five days a week in individual cylinder tanks (25 cm diameter × 50 cm depth), and supporting a load of 5% of body weight. This intensity corresponds to theaerobic/anaerobic metabolic transition during swimming exercise for rats [23]. Animals trained for the intermittent protocol were subjected to swimming for 30 s of activity interrupted by 30 s of rest in individual cylinder tanks (25 cm diameter ×50 cm depth), 20 minutes per day, 5 days a week, supporting an overload of 15% of body weight (Adapted from, Braga et al. [24]), beginning and weaning and continuing until 120 days of age.
The water temperature was maintained at 31 ± 1 °C, which is considered thermally neutral for rats [25, 26]. The training protocols had equivalent total weekly training loads (WL). According to Araujo et al. [27], WL represents the total stimuli of training, defined as the product of exercise time (t) and intensity (%).
In vivo evaluations
All animals had their body weight and food and water intake recorded once a week and were also evaluated with respect to glucose tolerance and insulin sensitivity.
Glucose tolerance test (OGTT)
Following a 12-hour fast, animals at 28, 60 and 120 days of age were subjected to an oral glucose tolerance test. First, blood collection from the tip of the tail was performed (time zero 0). Then, a polyethylene gastric catheter was orally introduced to the stomach, and a 20% (2 g/Kg of body weight) glucose solution was administered. Blood samples were collected at 30, 60 and 120 minutes after glucose administration, with heparinized capillaries calibrated to 25 mL, through a small cut on the tail. Glucose concentration was analyzed using the glucose-oxidase method (Kit glucose-Laborlab: CAT n° 02200-Guarulhos-SP) and insulin was analyzed by ELISA (Insulin Kit Diagnostic systems laboratories INC (DSL), REF: 10-1600, 445 medical Center BLVD, Webster, TX 77598, USA). A single incision at the tail was created to obtain all samples. The glucose and insulin responses during the OGTT were evaluated total areas under the curve for serum glucose and insulin using the trapezoidal method [28] and the ORIGIN 6.0 software (1999).
Insulin tolerance test (ITT)
To estimate insulin sensitivity of the animals at 28, 60 and 120 days of age, the insulin tolerance test (ITT) was employed. The test consisted of a bolus injection, administered subcutaneously in the dorsal region, of regular insulin solution (30mU/100g body weight). Blood samples (25 µL), obtained through a small cut on the end of the tail, were collected in heparinized capillaries at 0, 30, 60 and 120 minutes after glucose dosage (Glucose Kit - Laborlab: CAT n° 02200- Guarulhos- SP). A single incision at the tail was sufficient to obtain all samples. The serum glucose disappearance rate (Kitt) expressed in %/minute was calculated using the formula (0.693/t/2) × 100. A blood glucose (t/2) curve was calculated by a least squares analysis of the levels of serum glucose while there was a linear decrease after the administration of insulin [29].
Samples collection
At 120 days of age, all animals were sacrificed by decapitation after deep anesthesia with sodium amobarbital (15 mg/kg body weight), without fasting and 48 hours after the last in vivo procedure. Biological material was obtained.
Blood samples
Blood samples were collected to verify the concentrations of serum glucose (Glucose Kit-Laborlab: CAT no. 02200-Guarulhos-SP) and serum insulin using ELISA (Insulin Kit- Diagnostic systems laboratories INC (DSL), REF: 10-1600, 445 medical Center BLVD, Webster, TX 77598, USA).
Liver, heart and gastrocnemius muscle
These organs were removed for the determination of glycogen concentrations.Fractions weighing between 26-35 mg of liver, heart and gastrocnemius muscle were immediately digested in a water bath at 100 °C in 0.5 mL of 1N KOH for 20 minutes. A saturated solution of Na2SO4 (20 µL) was added, and glycogen was precipitated with two passages of 2.5 mL hot ethanol followed by centrifugation. The supernatant was discarded [30]. The glycogen precipitate was resuspended in 4 mL of water and colorimetric determination was performed in 1 mL of extract, 20 µL of 80% phenol and 2.0 mL concentrated sulfuric acid, after boiling for 15 minutes. The absorbance was measured in a spectrophotometer at 490 nm. Glucose solutions of known concentrations were used for calibration curves [31].
Soleus muscle
Muscle was assessed for glucose uptake and oxidation, and for glycogen synthesis and concentration, according to the procedure described by Ribeiro et al. [17].
Briefly, after sacrifice, the soleus muscles from both paws were removed and longitudinal strips (25 and 35 mg) were placed in 20 mL glass scintillation vials containing 1.5 mL of Krebs-bicarbonate buffer. The vials were closed with rubber lids, sealed with plastic rings and subjected to 30 minutes of pre-incubation while shaking in a Dubinoff-type bath at 60 rpm with continuous gas injection of O2/CO2 (95%/15%). After this period, the muscle strips were transferred into new scintillation vials (outer vial) small scoop-shaped tubes inside (inner vial) using a straight stick of approximately 3 cm that was inserted into the rubber lids of the outer vial. Each outer vial contained 1.5 mL of Krebs-Ringer buffer and each inner vial 700 mL of hyamin 10 ×. After 60 minutes of incubation in this system, with gas injection during the first 15 minutes, 100 mL of 25% trichloroacetic acid (TCA) were added to the outer vial, aiming at the CO2 release. The muscle strips were placed out of reach of chemical solutions and the preparation was kept 3 more hours in the system. After this period, 200 mL of the solution from the inner vial was collected for the determination of the CO2 produced. The muscle strip was immediately digested in 0.5 mL of KOH [30] for muscle glycogen dosage [31]. The pre-incubation and incubation temperature was of 37 °C. The glucose uptake, using 2-DG and incorporation of 14C into glycogen (synthesis), were evaluated by measuring the 3H of the 2-DG and the glucose 14C radioactivity, in the precipitate and alkaline phase of the glycogen extraction respectivelly. For the estimation of the oxidized glucose (CO2 production), the radioactivity of the 14 C present in the liquid (hyamin) collected from the inner vial of the incubation system was determined. All measurements of radioactivity were carried out in a Packard Tricarb 2100 scintillation counter, in a Triton X-100 Toluene-based scintillant.
Statistical analysis
Data analysis was performed using a student t-test or analysis of variance two-way ANOVA, followed by Bonferroni post-hoc test when appropriate. In all cases, the level of significance was preset at 5% (P < 0.05).
| Results | ▴Top |
The values of the area under the curve for body weights during the experiment are shown in Fig. 2. The IA group presented a higher area compared to the corresponding control, ITC. The SC group showed higher values than the CC and IC groups, showing the effectiveness of continuous and intermittent training protocols in weight control animals. Fig. 3A and 3B present the values for area under the curve for food and water intake, respectively, of the animals. No differences were observed between the groups.
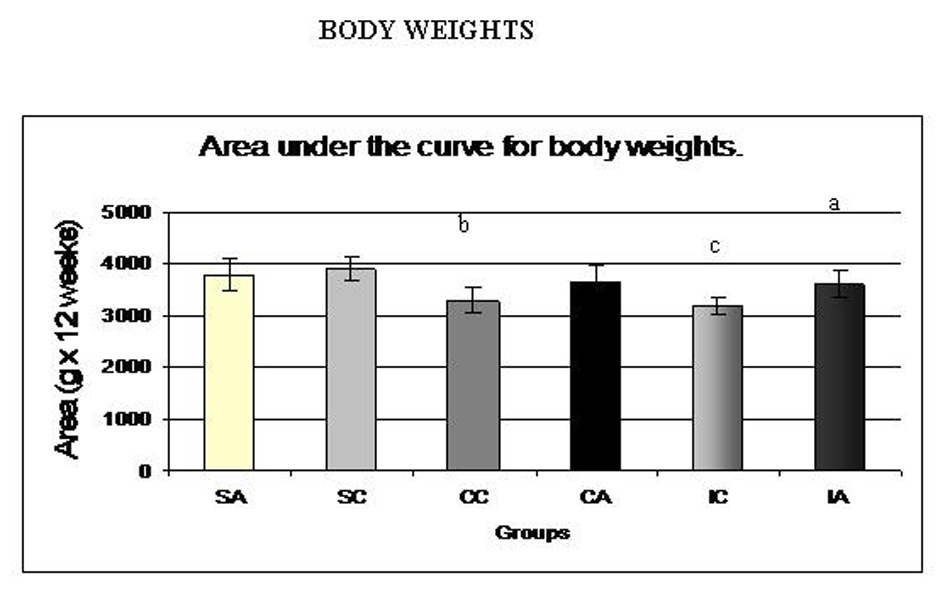 Click for large image | Figure 2. Area under the curve for body weights of the animals at weaning (28 days) until the end of the experiment (120 days). Results are expressed as means ± standard deviation of 10 animals per group. SA: Sedentary alloxan; SC: Sedentary control; CC: Continuous training control; CA: Continuous training alloxan; IC: Intermittent training control and IA: Intermittent training alloxan. Different letters indicate a statistically significant difference among groups (Two-way ANOVA (3 x 2) and Bonferroni post hoc test, P < 0.05). a: statistically significant difference for IA versus IC; b: statistically significant difference for SC versus CC; c: statistically significant difference for SC versus IC. |
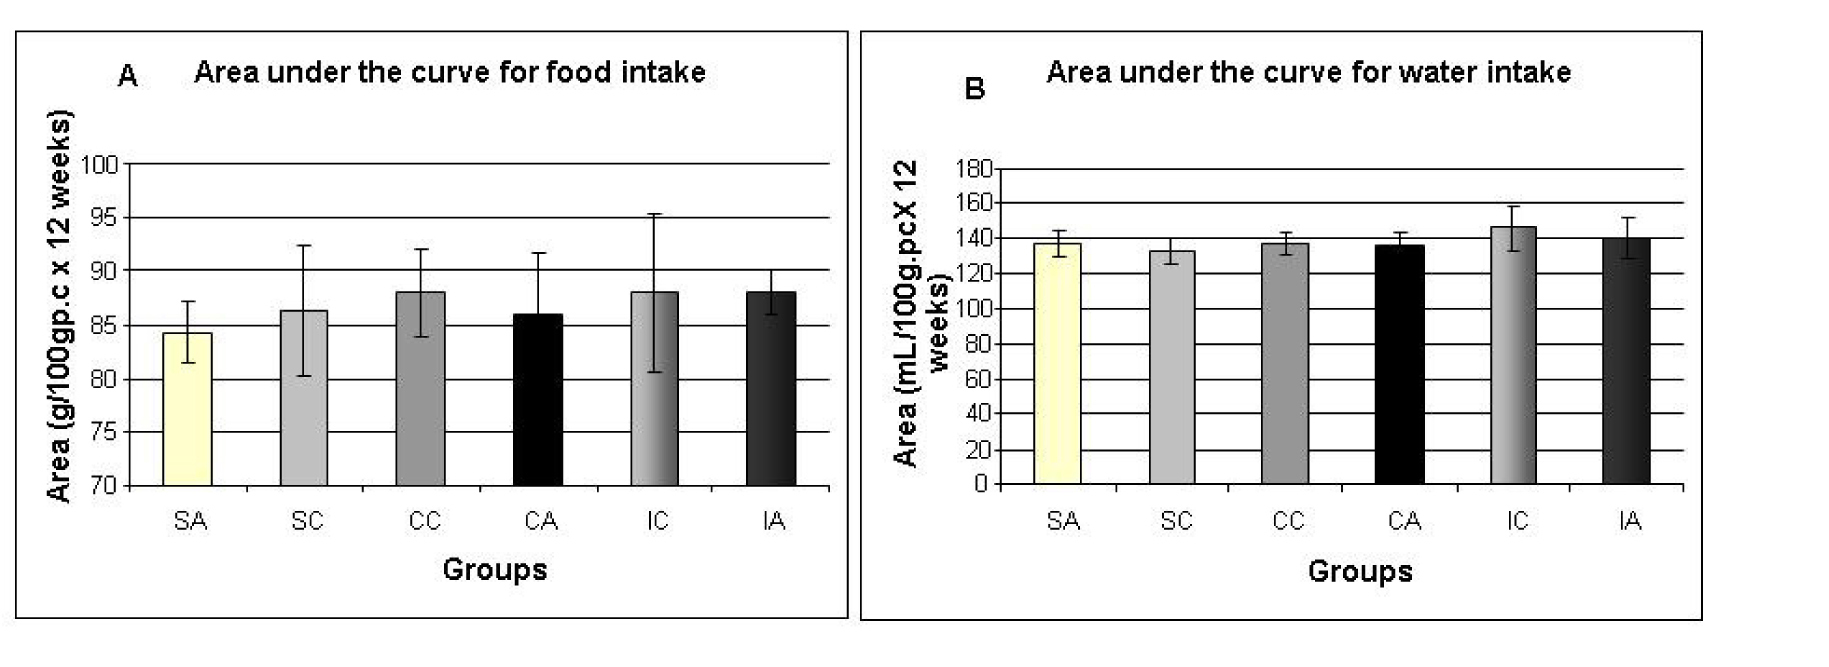 Click for large image | Figure 3. Area under the curve for food intake (A) and water intake (B) of the animals at weaning (28 days) until the end of the experiment (120 days). Results are expressed as means ± standard deviation of 10 animals per group. SA: Sedentary alloxan; SC: Sedentary control; CC: Continuous training control; CA: Continuous training alloxan; IC: Intermittent training control and IA: Intermittent training alloxan. |
Glucose tolerance test (OGTT) and insulin tolerance tests (ITT) were performed at 28, 60 and 120 days. The results of OGTT were analyzed by calculating the area under the curve for serum glucose and insulin during the test. Fig. 4A and 4B show the areas under the curve for serum glucose and insulin during the oral glucose tolerance test performed at 28 days. The alloxan group showed higher area under the glucose curve (Fig. 4A) when compared with controls, indicating glucose intolerance in the alloxan group. The same trend was observed when measuring the area under the insulin curve (Fig. 4B), as the alloxan group showed higher values than the control group.
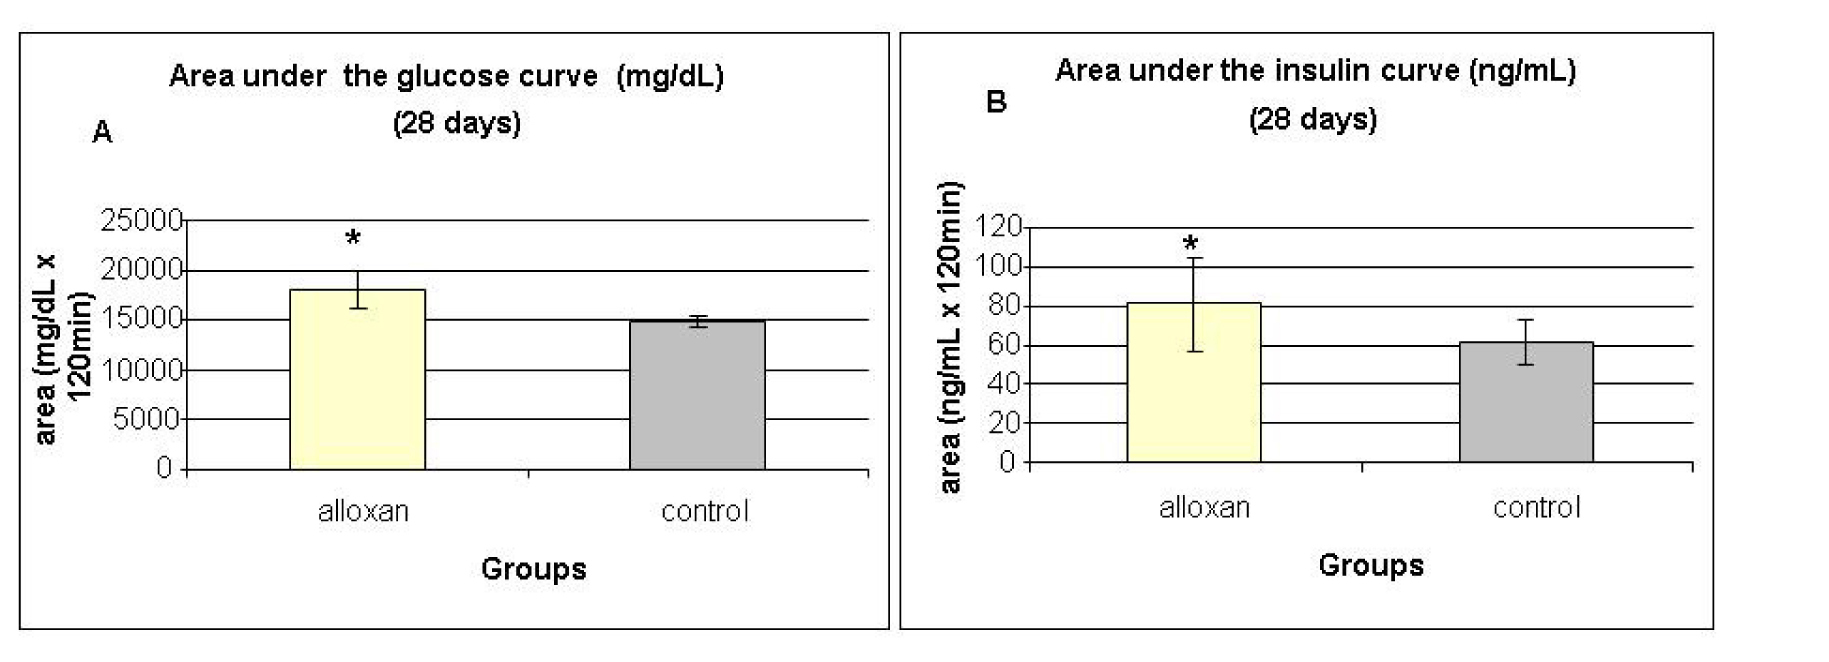 Click for large image | Figure 4. Area under the glucose curve (A) and area under the insulin curve (B) at weaning (28 days) during the glucose tolerance test (OGTT). Results are expressed as means ± standard deviation of 10 animals per group. *: statistically significant different ( student test, P < 0.05) from control group. |
Insulin sensitivity was assessed by ITT and analyzed by calculating the serum glucose disappearance rate (Kitt) during the test (Fig. 5). Kitt values were lower in the alloxan treated group compared to the control group, showing insulin resistance in the alloxan animals.
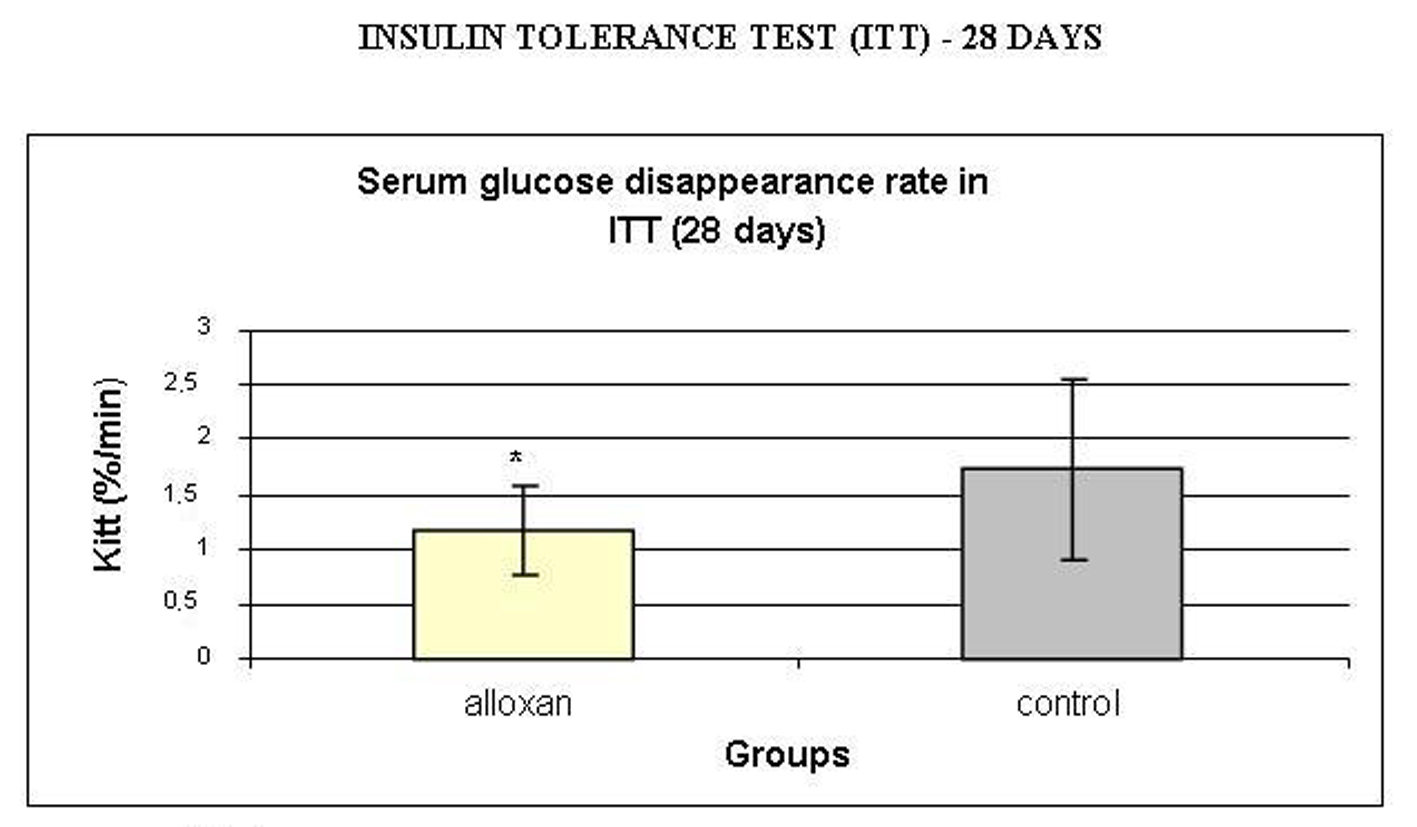 Click for large image | Figure 5. Serum glucose disappearance rate (Kitt, %/min) during insulin tolerance test (ITT). Results are expressed as means ± standard deviation of 10 animals per group. *: statistically significant different (student test, P < 0.05) from control group. |
Fig. 6A and 6B show the area under the curve for serum glucose and insulin during the oral glucose tolerance test (OGTT) performed at 60 days.
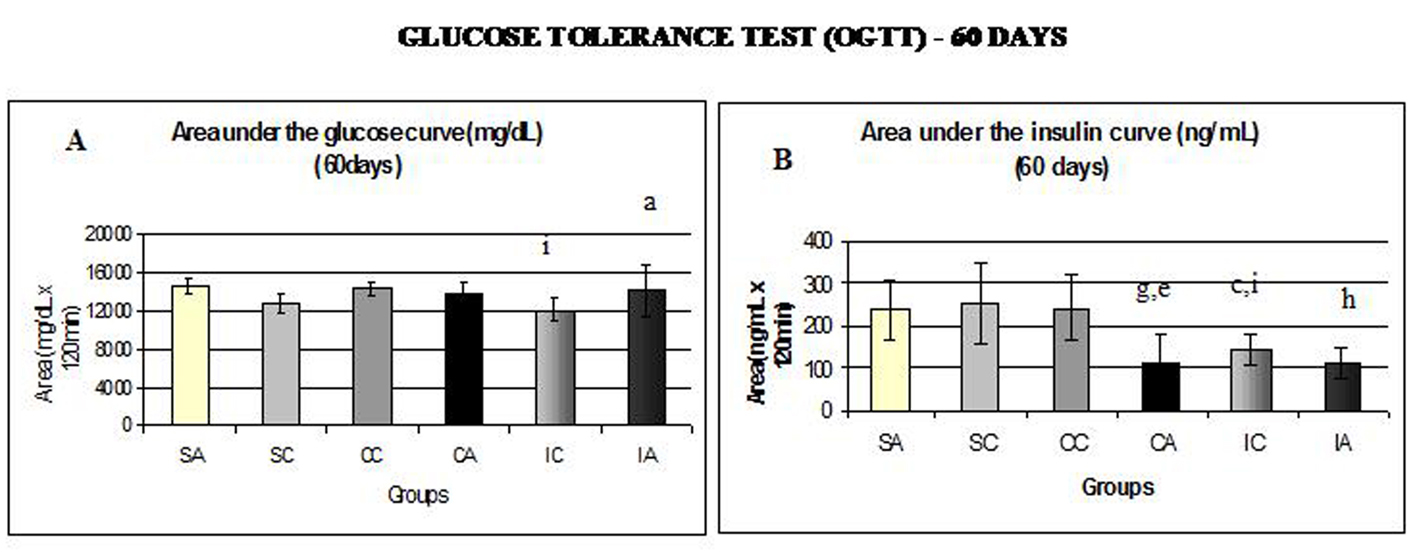 Click for large image | Figure 6. Area under the glucose curve (A) at 60 days and area under the insulin curve (B) at 60 days during glucose tolerance test (OGTT). Results are expressed as means ± standard deviation of 10 animals per group. SA: Sedentary alloxan; SC: Sedentary control; CC: Continuous training control; CA: Continuous training alloxan; IC: Intermittent training control and IA: Intermittent training alloxan. Different letters indicate a statistically significant difference among groups (Two-way ANOVA (3 x 2) and Bonferroni post hoc test, P < 0.05), referring to area under the glucose and insulin curve. a: statistically significant differences for IA versus IC; c: statistically significant differences for SC versus IC; e: statistically significant differences for CA versus CC; g: statistically significant differences for SA versus CA; h: statistically significant differences for SA versus IA; i: statistically significant differences for CC versus IC. |
The IA and CC groups showed higher values for the area under the glucose curve (Fig. 6A) compared to IC. Regarding the area under the insulin curve (Fig. 6B), the SA group presented higher values than the CA and IA groups; the CA group presented lower values than CC group; and CC and SC groups had higher area than the IC group. In relation to insulin sensitivity (Fig. 7), assessed by Kitt at 60 days, no statistical differences were observed.
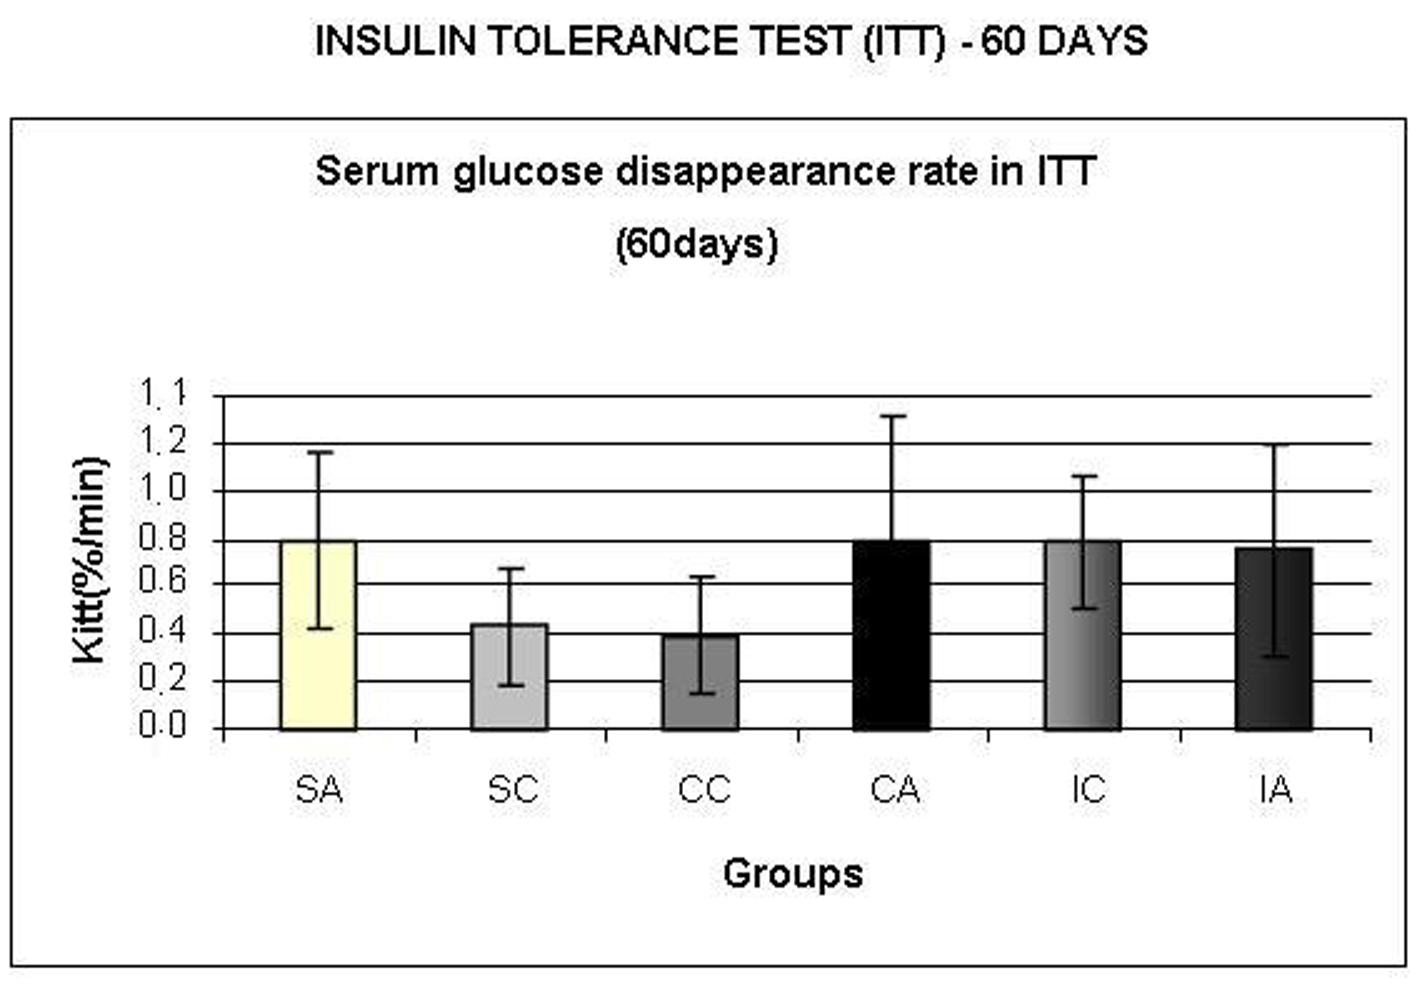 Click for large image | Figure 7. Serum glucose disappearance rate (Kitt,) during insulin tolerance test (ITT) at 60 days. Results are expressed as means ± standard deviation of 10 animals per group. SA: Sedentary alloxan; SC: Sedentary control; CC: Continuous training control; CA: Continuous training alloxan; IC: Intermittent training control and IA: Intermittent training alloxan. |
Fig. 8A shows the area under the curve for serum glucose during OGTT, performed at 120 days. The ITA group showed a higher area than the ITC group. Regarding the area under the insulin curve (Fig. 8B) and insulin sensitivity (Fig. 9) evaluated by Kitt, there were no statistical differences between groups.
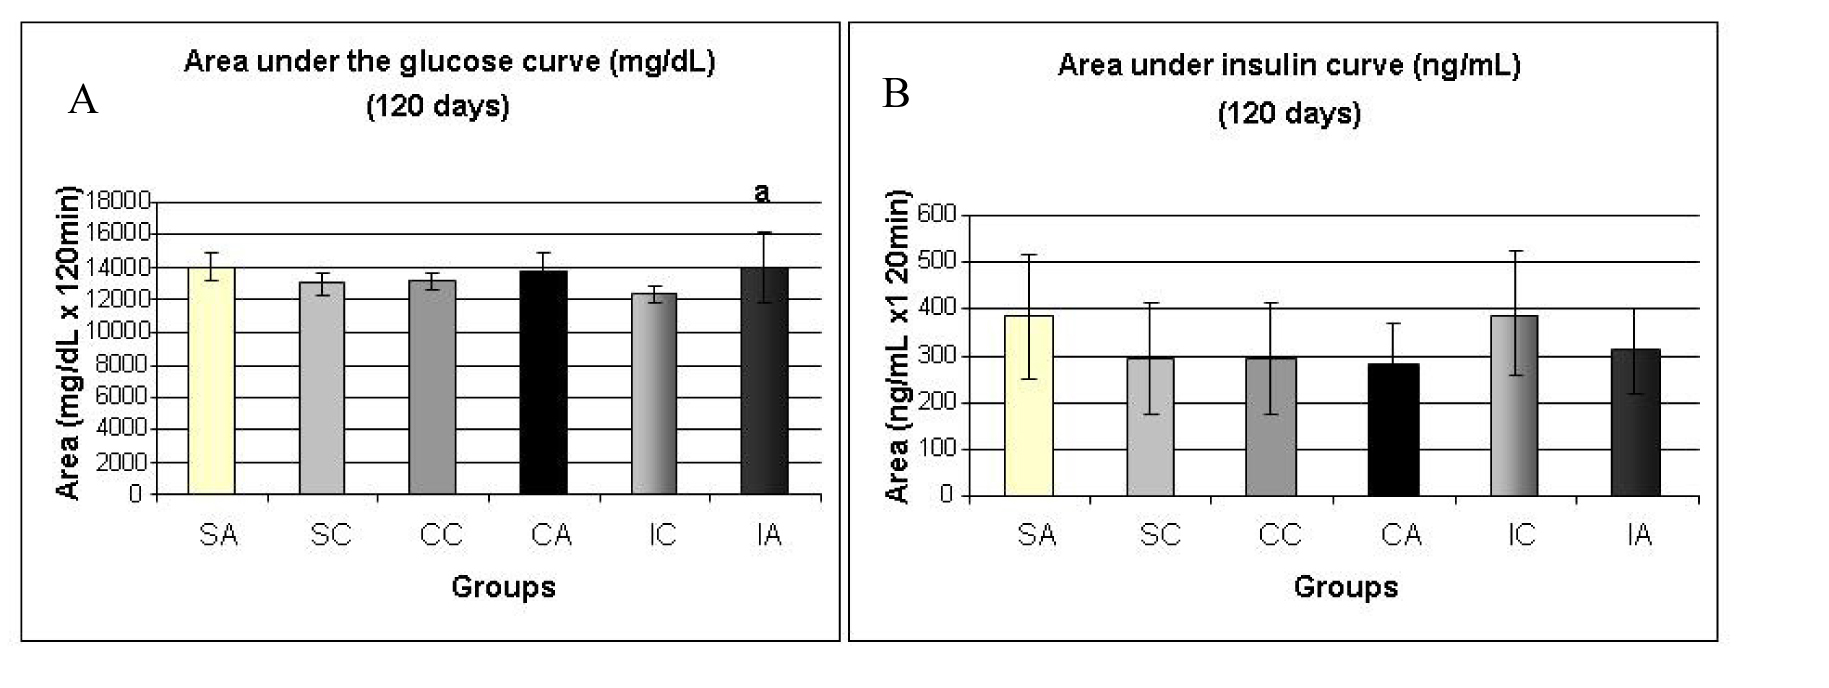 Click for large image | Figure 8. Area under the glucose curve (A) at 120 days and area under the insulin curve (B) at 120 days during the glucose tolerance test (OGTT). Results are expressed as means ± standard deviation of 10 animals per group. SA: Sedentary alloxan; SC: Sedentary control; CC: Continuous training control; CA: Continuous training alloxan; IC: Intermittent training control and IA: Intermittent training alloxan. Different letters indicate a statistically significant difference among groups (Two-way ANOVA (3 x 2) and Bonferroni post hoc test, P < 0.05), referring to area under the glucose curve a, statistically significant differences for IA versus IC. |
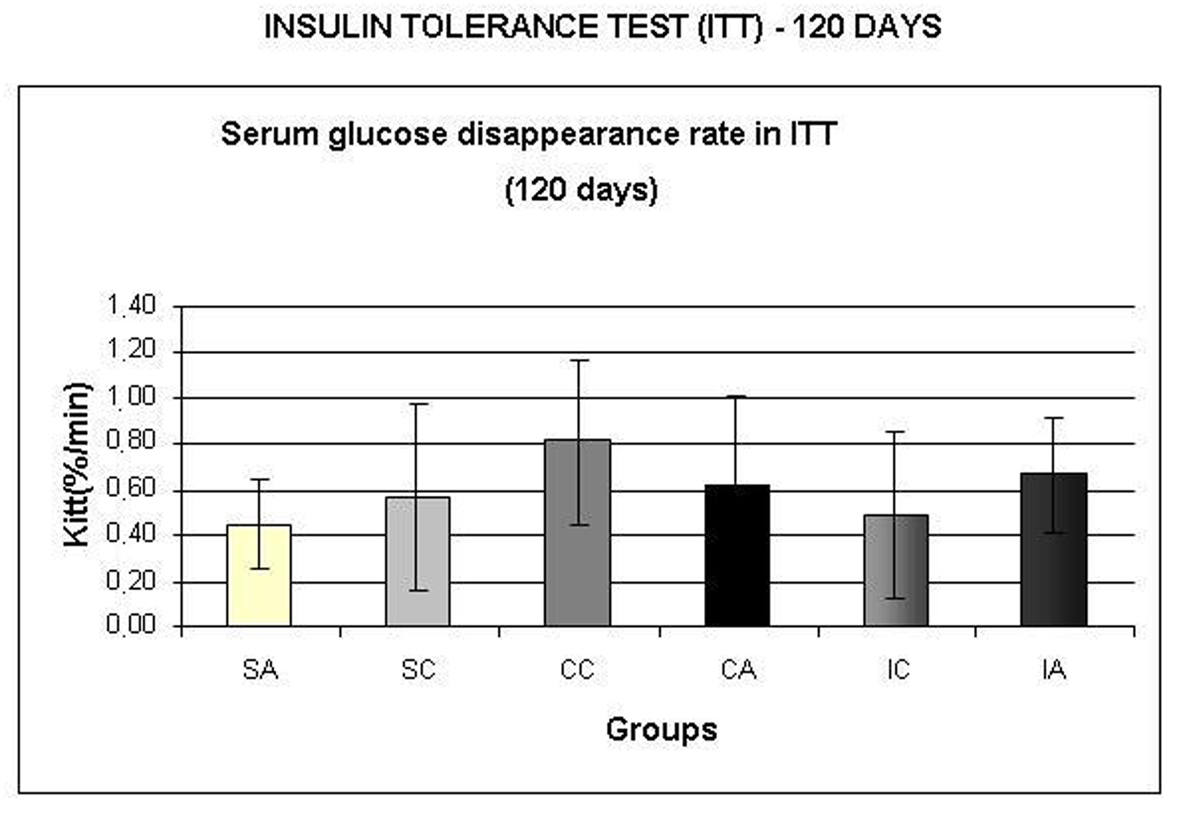 Click for large image | Figure 9. Serum glucose disappearance test (Kitt,) during insulin tolerance test (ITT) at 120 days. Results are expressed as means± standard deviation of 10 animals per group. SA: Sedentary alloxan; SC: Sedentary control; CC: Continuous training control; CA: Continuous training alloxan; IC: Intermittent training control and IA: Intermittent training alloxan. |
Serum glucose and insulin, as well as gastrocnemius muscle, liver and heart glycogen concentrations, were measured at 120 days, and the data are shown in Table 1. Differences were found only in the glycogen concentration of the gastrocnemius muscle, where the SC and IA groups had lower concentrations than the IC group.
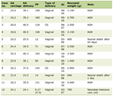 Click to view | Table 1. Serum Glucose, Insulin Concentrations and Gastrocnemius Muscle, Liver and Heart Glycogen Concentrations at 120 days |
Table 2 presents data from glucose uptake and oxidation and glycogen synthesis and concentration in the soleus muscle isolated from the animals at 120 days. The SA group showed lower glucose oxidation rates than the CA group. AS and CA groups had lower glucose uptake levels than the IA group, and the SC and CC groups had lower values than IC group. These data indicated greater effectiveness of the intermittent training protocol on glucose uptake compared to the continuous training protocol. The CA group showed higher soleus muscle glycogen concentration than the SA group.
Click to view | Table 2. Glucose Uptake and Oxidation, Glycogen Synthesis and Concentration in the Soleus Muscle at 120 days |
| Discussion | ▴Top |
T2DM is characterized by insulin resistance and glucose intolerance. Exercise triggers metabolic adjustments, which may attenuate complications of the disease. Therefore, exercise is extremely important in the prevention and treatment of T2DM. Thus, this study aimed to compare the effects of intermittent and continuous swimming training on glucose metabolism in rats after neonatal alloxan application.
The data from this study demonstrated the efficacy of the neonatal alloxan administration in impairing the glucose homeostasis of the animals. These data are consistent with previous studies of the same model [14-17, 20].
Many patients with T2DM are obese, and obesity by itself may lead to the development of insulin resistance. This condition can improve with weight reduction combined with regular physical activity [32]. In this study, all animals had body weight, water and food intake recorded once a week. When we analyzed the area under the curve for the body weight of the animals during the experiment, the sedentary alloxan animals had area under the curve values for body weight similar to those of corresponding controls. Animals that performed intermittent and continuous swim training presented lower body weight values than their sedentary counterparts, showing the effectiveness of the training protocols for body weight control. This result is of great importance to the prevention and development of obesity and of insulin resistance. Kodama et al. [14], using the same model of neonatal administration of alloxan, showed no change in body weight of alloxan rats when compared with sedentary controls. Oliveira et al. [15] found similar results to those reported in this study, as they also demonstrated reduced weight gain after continuous moderate swimming training in neonatal alloxan administered rats. In relationInIn addition, no differences in food intake were found between groups. Similar results were reported in a previous study by our group [15]. In contrast, Kodama et al. [14] showed lower food intake in alloxan animals than in controls. With respect to water intake, there were no differences between groups in this study, whereas Oliveira et al. [15] found an increase in trained animals. It is noteworthy that, in the present study, the animals had reduced body weight due to the increased energy expenditure required during exercise and not due to decreased food intake.
Glucose tolerance and insulin sensitivity were evaluated by the OGTT and ITT tests at 28, 60 and 120 days old.
At 28 days, we observed glucose intolerance and insulin resistance in alloxan animals, after a greater area under the curve for serum glucose and insulin was observed during the OGTT, and we observed a lower Kitt during the ITT for alloxan animals. Similar results were reported in Oliveira et al. [15] and Contarteze et al. [16]. Together, these data indicate the effectiveness of neonatal administration of alloxan in the alteration of glucose homeostasis in rats.
The area under the curve for serum glucose during the OGTT at 60 days, revealed a trend towards glucose intolerance by sedentary alloxan animals because the area under the glycemic curve was slightly higher compared to the corresponding control. Furthermore, after 4 weeks of intermittent training, control rats showed improved glucose tolerance when compared to continuous training counterparts, indicating the benefits of this type of training for glucose homeostasis. Moreover, both the continuous and intermittent trainings were effective in reducing the area under the curve for insulinemia in alloxan and control groups. Unlike Contarteze et al. [16], who found differences between the control and alloxan groups in insulin sensitivity by the HOMA index, in this present study, no difference between groups in insulin sensitivity was observed when we analyzed the Kitt.
At 120 days, no significant difference between the groups in the areas under the serum glucose curve during OGTT and the Kitt were detected. After 12 weeks of training, no difference was evident within these parameters, contrasting with the results of Mota et al. [20] showing that after 12 weeks of continuous training in the intensity of maximal lactate steady state, observed improvement in glucose tolerance in the trained groups.
In the present study, serum glucose and insulin, in the fed state at the end of the experiment, were evaluated. There were no differences between groups, despite the presentation of glucose intolerance by the alloxan rats when subjected to an oral glucose overload.
It is known that glycogen synthesis in skeletal muscle has an important role in glucose homeostasis [33-35]. The ability of insulin to increase glucose utilization by muscle involves the stimulation of glucose transporters and activation of glycogen synthase [36, 37]. Both the basal and insulin-stimulated activity of the glycogen synthase enzyme is impaired in the skeletal muscle of T2DM, which may have an important role in the development of glucose intolerance and insulin resistance [38-41]. The liver glycogen content of adult rats with diabetes is increased compared with control rats, and high intensity training reduces these stores [42]. Therefore, in the present study, glycogen concentrations in the gastrocnemius muscle, liver and heart were measured to verify the influence of training on the storage of this substrate in alloxan animals. Intermittent training was more effective in increasing the gastrocnemius muscle glycogen storage than continuous training in the control group. This is probably due to the exercise intensity and metabolism required during the training, associated with the type of fibers (glycolytic) predominant in this muscle. Moreover, alloxan animals that performed intermittent training presented lower glycogen content in the gastrocnemius muscle than the corresponding controls.
In the present study, the soleus muscle was isolated for the analysis of glucose oxidation and uptake, and glycogen synthesis and concentration, during the incubation of the muscle. The alloxan sedentary group had lower glucose oxidation than the alloxan continuous training groups. With respect to glucose uptake, the sedentary and the continuous training groups had lower values than those that received intermittent training. Continuous training increased soleus muscle glycogen stores in the alloxan group when compared to the sedentary group. This result highlights the efficiency of the continuous training protocol on glycogen storage in muscles with oxidative characteristics. Therefore, regular exercise can influence glucose homeostasis in rats subjected to neonatal administration of alloxan, by increasing muscle glucose uptake and oxidation. Glucose utilization is synergistically stimulated by exercise training and insulin, and chronic exercise induces a decrease in the blood glucose levels of diabetic rats [43, 44]. The mechanisms that locally act to improve glucose uptake are increased muscle blood flow, insulin binding to its receptor (the insulin receptor, IR), IR turnover, stimulated AMPK (adenosine monophosphate-activated protein kinase), AS160 (AKT substrate) and increased glucose transport by stimulating GLUT4 translocation to the muscle cell surface [43, 45]. Chronic exercise induces alterations in responsiveness to insulin in skeletal muscle, which may result, at least in part, in the modulation of the insulin signaling pathway at different molecular levels, in particular, theIRS/PI3-kinase pathway [5].
In summary, the neonatal administration of alloxan was effective in inducing changes in glucose homeostasis, such as glucose intolerance and insulin resistance in animals. The continuous training was effective in attenuating increases in serum insulin after oral glucose overload, without affecting the glycemic response in alloxan treated rats. Intermittent training also attenuated the insulinemic response to oral glucose overload in alloxan treated rats, but impaired the glycemic response. Furthermore, the intermittent training protocol improved glucose uptake by the skeletal muscle of alloxan treated rats, while continuous training improved muscle glucose oxidation. Therefore, both continuous and intermittent protocol exerted beneficial effects on glucose homeostasis of alloxan treated rats.
Acknowledgments
This research was supported by the Fundacao de Amparo a Pesquisa do Estado de Sao Paulo (FAPESP, process 09/51538-5), the Coordenacao de Aperfeicoamento de Ensino Superior (CAPES), and the Conselho Nacional de Desenvolvimento Cientifico e Tecnologico (CNPq). We thank Clarice Y Sibuya, Eduardo Custodio and Jose Roberto R. Silva for excellent technical assistance. This manuscript was edited by American Journal Experts (key: A1BF-F737-F54E-CF08-396D).
Conflict of Interests
The authors declare that they have no competing interests.
Authors’ Contributions
Ribeiro, C. conceived the study, developed the study protocol, reviewed the references, collected and analyzed the data, and wrote the paper. Cambri, L.T., Dalia, R.A., Araújo, M.B., Leme, JACA.,Moura, RF., Voltarelli, FA participated in the design of the study, reviewed the manuscript, collected the data, and collaborated on the biochemical dosages. Mello, M.A.R conceived the study, participated in its design and coordination and helped in the drafting of the manuscript. All authors read and approved the submission of the final manuscript.
| References | ▴Top |
- Wild S, Roglic G, Green A, Sicree R, King H. Global prevalence of diabetes: estimates for the year 2000 and projections for 2030. Diabetes Care. 2004;27(5):1047-1053.
pubmed doi - Standards of medical care in diabetes—2010. Diabetes Care. 2010;33 Suppl 1:S11-61.
pubmed - Hayashi T, Hirano T, Yamamoto T, Ito Y, Adachi M. Intensive insulin therapy reduces small dense low-density lipoprotein particles in patients with type 2 diabetes mellitus: relationship to triglyceride-rich lipoprotein subspecies. Metabolism. 2006;55(7):879-884.
pubmed doi - Ivy JL, Zderic TW, Fogt DL. Prevention and treatment of non-insulin-dependent diabetes mellitus. Exerc Sport Sci Rev. 1999;27:1-35.
pubmed - Luciano E, Carneiro EM, Carvalho CR, Carvalheira JB, Peres SB, Reis MA, Saad MJ, et al. Endurance training improves responsiveness to insulin and modulates insulin signal transduction through the phosphatidylinositol 3-kinase/Akt-1 pathway. Eur J Endocrinol. 2002;147(1):149-157.
pubmed doi - Ivey FM, Ryan AS, Hafer-Macko CE, Goldberg AP, Macko RF. Treadmill aerobic training improves glucose tolerance and indices of insulin sensitivity in disabled stroke survivors: a preliminary report. Stroke. 2007;38(10):2752-2758.
pubmed doi - Manneras L, Jonsdottir IH, Holmang A, Lonn M, Stener-Victorin E. Low-frequency electro-acupuncture and physical exercise improve metabolic disturbances and modulate gene expression in adipose tissue in rats with dihydrotestosterone-induced polycystic ovary syndrome. Endocrinology. 2008;149(7):3559-3568.
pubmed doi - Baynard T, Carhart RL, Jr., Ploutz-Snyder LL, Weinstock RS, Kanaley JA. Short-term training effects on diastolic function in obese persons with the metabolic syndrome. Obesity (Silver Spring). 2008;16(6):1277-1283.
pubmed doi - Thyfault JP. Setting the stage: possible mechanisms by which acute contraction restores insulin sensitivity in muscle. Am J Physiol Regul Integr Comp Physiol. 2008;294(4):R1103-1110.
pubmed - Venables MC, Jeukendrup AE. Endurance training and obesity: effect on substrate metabolism and insulin sensitivity. Med Sci Sports Exerc. 2008;40(3):495-502.
pubmed doi - Koutroumpi M, Pitsavos C, Stefanadis C. The role of exercise in cardiovascular rehabilitation: a review. Acta Cardiol. 2008;63(1):73-79.
pubmed doi - Srinivasan K, Ramarao P. Animal models in type 2 diabetes research: an overview. Indian J Med Res. 2007;125(3):451-472.
pubmed - Portha B, Blondel O, Serradas P, McEvoy R, Giroix MH, Kergoat M, Bailbe D. The rat models of non-insulin dependent diabetes induced by neonatal streptozotocin. Diabete Metab. 1989;15(2):61-75.
pubmed - Kodama T, Iwase M, Nunoi K, Maki Y, Yoshinari M, Fujishima M. A new diabetes model induced by neonatal alloxan treatment in rats. Diabetes Res Clin Pract. 1993;20(3):183-189.
pubmed doi - de Oliveira CA, Luciano E, de Mello MA. The role of exercise on long-term effects of alloxan administered in neonatal rats. Exp Physiol. 2005;90(1):79-86.
pubmed doi - Contarteze RV, de Alencar Mota CS, de Oliveira CA, de Almeida Leme JA, Bottcher LB, de Mello MA, Luciano E. Exercise test and glucose homeostasis in rats treated with alloxan during the neonatal period or fed a high calorie diet. J Diabetes. 2009;1(1):65-72.
pubmed doi - Ribeiro C, de Oliveira CA, Luciano E, de Mello MA. Diabetes evolution in rats after neonatal treatment with alloxan. Res Commun Mol Pathol Pharmacol. 2005;117-118:29-46.
pubmed - Guelfi KJ, Ratnam N, Smythe GA, Jones TW, Fournier PA. Effect of intermittent high-intensity compared with continuous moderate exercise on glucose production and utilization in individuals with type 1 diabetes. Am J Physiol Endocrinol Metab. 2007;292(3):E865-870.
pubmed doi - Kuwajima MDM et al. The preventive effect of caloric restriction and exercise training on the onset of NIDDM in a rat model. Nutrition Research. 1999; 19: 401-413.
- Soares de Alencar Mota C, Ribeiro C, de Araujo GG, de Araujo MB, de Barros Manchado-Gobatto F, Voltarelli FA, de Oliveira CA, et al. Exercise training in the aerobic/anaerobic metabolic transition prevents glucose intolerance in alloxan-treated rats. BMC Endocr Disord. 2008;8:11.
pubmed - Coskun O, Ocakci A, Bayraktaroglu T, Kanter M. Exercise training prevents and protects streptozotocin-induced oxidative stress and beta-cell damage in rat pancreas. Tohoku J Exp Med. 2004;203(3):145-154.
pubmed doi - Luciano E, Lima FB. Metabolismo de ratos diabéticos treinados submetidos ao jejum e ao exercício agudo. Revista de Ciências Biomédicas. 1997; 18: 47-60.
- Gobatto CA, de Mello MA, Sibuya CY, de Azevedo JR, dos Santos LA, Kokubun E. Maximal lactate steady state in rats submitted to swimming exercise. Comp Biochem Physiol A Mol Integr Physiol. 2001;130(1):21-27.
pubmed doi - Ribeiro Braga L, de Mello MA, Gobatto CA. [Continuous and intermittent exercise: effects of training and detraining on body fat in obese rats]. Arch Latinoam Nutr. 2004;54(1):58-65.
pubmed - Azevedo JRM. Determinação de parâmetros bioquímicos em ratos sedentários e treinados após exercício agudo de natação. PhD thesis. Departamento de Fisiologia e Biofísica, Universidade Estadual de Campinas; 1994.
- Pauli JR: Efeitos do treinamento físico sobre aspectos endócrino-metabólicos de ratos administrados com dexametasona. PhD thesis. Instituto de Biociências da Universidade Estadual Paulista, Rio Claro; 2005.
- Araújo GG, Papoti M, Manchado-Gobatto FB, Mello MAR, Gobatto CA. Padronização de um Protocolo Experimental de Treinamento Periodizado em Natação Utilizando Ratos Wistar. Revista Brasileira de Medicina do Esporte. 2010; 16: 51-56.
- Matthews JN, Altman DG, Campbell MJ, Royston P. Analysis of serial measurements in medical research. BMJ. 1990;300(6719):230-235.
pubmed doi - Lundbaek K. Intravenous glucose tolerance as a tool in definition and diagnosis of diabetes mellitus. Br Med J. 1962;1(5291):1507-1513.
pubmed doi - Sjörgreen B, Nordenskjold DT, Holmgren H, Wollerstrom J. Bertrag zur Kentnin des le birrhythmik. Pfluger Arch. Gesante Physiol. 1938: 240- 247.
- Dubois B, Giles KA, Hamilton JK. et al. Calorimetric method for determination of sugar and related substances. Analytical Chemistry . 1956; 28: 350-356.
- Diagnosis and classification of diabetes mellitus. Diabetes Care. 2009;32 Suppl 1:S62-67.
pubmed - Daniel PM, Love ER, Pratt OE. Insulin-stimulated entry of glucose into muscle in vivo as a major factor in the regulation of blood glucose. J Physiol. 1975;247(2):273-288.
pubmed - Baron AD, Brechtel G, Wallace P, Edelman SV. Rates and tissue sites of non-insulin- and insulin-mediated glucose uptake in humans. Am J Physiol. 1988;255(6 Pt 1):E769-774.
pubmed - Shulman GI, Rothman DL, Jue T, Stein P, DeFronzo RA, Shulman RG. Quantitation of muscle glycogen synthesis in normal subjects and subjects with non-insulin-dependent diabetes by 13C nuclear magnetic resonance spectroscopy. N Engl J Med. 1990;322(4):223-228.
pubmed doi - Rodnick KJ, Piper RC, Slot JW, James DE. Interaction of insulin and exercise on glucose transport in muscle. Diabetes Care. 1992;15(11):1679-1689.
pubmed doi - Manchester J, Skurat AV, Roach P, Hauschka SD, Lawrence JC, Jr. Increased glycogen accumulation in transgenic mice overexpressing glycogen synthase in skeletal muscle. Proc Natl Acad Sci U S A. 1996;93(20):10707-10711.
pubmed doi - Bogardus C, Lillioja S, Stone K, Mott D. Correlation between muscle glycogen synthase activity and in vivo insulin action in man. J Clin Invest. 1984;73(4):1185-1190.
pubmed doi - Bak J, Pedersen O. Glycogen synthase: characteristics and putative role in insulin insensitivity. Diabetes Annals. 1994; 8:75–105.
- Thorburn AW, Gumbiner B, Bulacan F, Wallace P, Henry RR. Intracellular glucose oxidation and glycogen synthase activity are reduced in non-insulin-dependent (type II) diabetes independent of impaired glucose uptake. J Clin Invest. 1990;85(2):522-529.
pubmed doi - Henry RR, Ciaraldi TP, Abrams-Carter L, Mudaliar S, Park KS, Nikoulina SE. Glycogen synthase activity is reduced in cultured skeletal muscle cells of non-insulin-dependent diabetes mellitus subjects. Biochemical and molecular mechanisms. J Clin Invest. 1996;98(5):1231-1236.
pubmed doi - Ferreira LD, Brau L, Nikolovski S, Raja G, Palmer TN, Fournier PA. Effect of streptozotocin-induced diabetes on glycogen resynthesis in fasted rats post-high-intensity exercise. Am J Physiol Endocrinol Metab. 2001;280(1):E83-91.
pubmed - Zinman B, Ruderman N, Campaigne BN, Devlin JT, Schneider SH. Physical activity/exercise and diabetes. Diabetes Care. 2004;27 Suppl 1:S58-62.
pubmed - Leme JA, Gomes RJ, de Mello MA, Luciano E. Effects of short-term physical training on the liver IGF-I in diabetic rats. Growth Factors. 2007;25(1):9-14.
pubmed doi - Manetta J, Brun JF, Maimoun L, Callis A, Prefaut C, Mercier J. Effect of training on the GH/IGF-I axis during exercise in middle-aged men: relationship to glucose homeostasis. Am J Physiol Endocrinol Metab. 2002;283(5):E929-936.
pubmed
This is an open-access article distributed under the terms of the Creative Commons Attribution License, which permits unrestricted use, distribution, and reproduction in any medium, provided the original work is properly cited.
Journal of Endocrinology and Metabolism is published by Elmer Press Inc.